
Figure 3. Purification of human neutrophils from skin window.
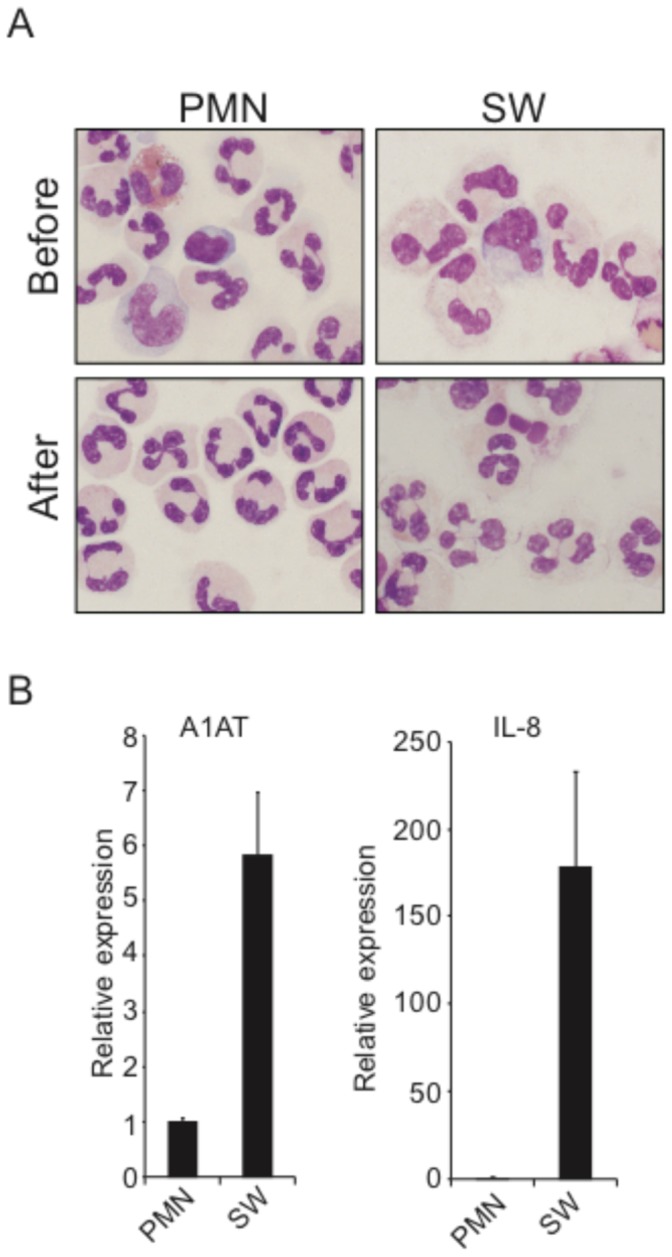
A, Cytospins (1–2×10⁵ cells) of the PMN and skin window (SW) neutrophil populations before and after immunomagnetic depletion of non-neutrophil cells. B, RT-PCR data on RNA purified from the two different cell populations. Expression of the marker mRNAs IL-8 and A1AT are shown relative to the cell population with the lowest amount, which is given the value 1. Error bars (SD) show the difference in expression between two donors.