
Figure 4. miRNA array analysis of human neutrophils from skin window.
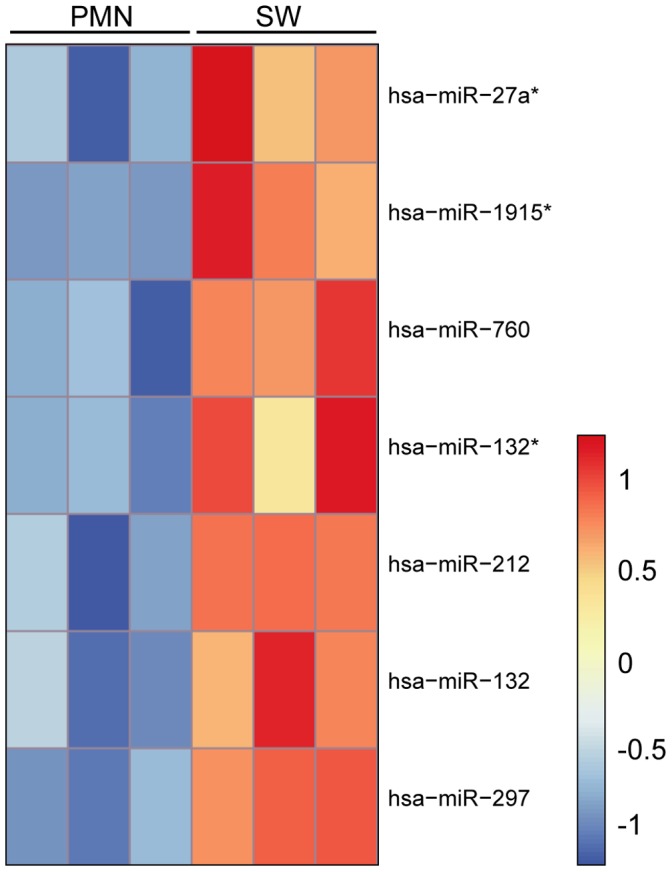
Heat map of the seven differentially regulated miRNAs between peripheral blood PMNs and activated neutrophil populations in skin windows. The different miRNAs are listed on the right side of the heatmap and the two different cell populations are marked on the top. Red indicates high expression and blue low expression.