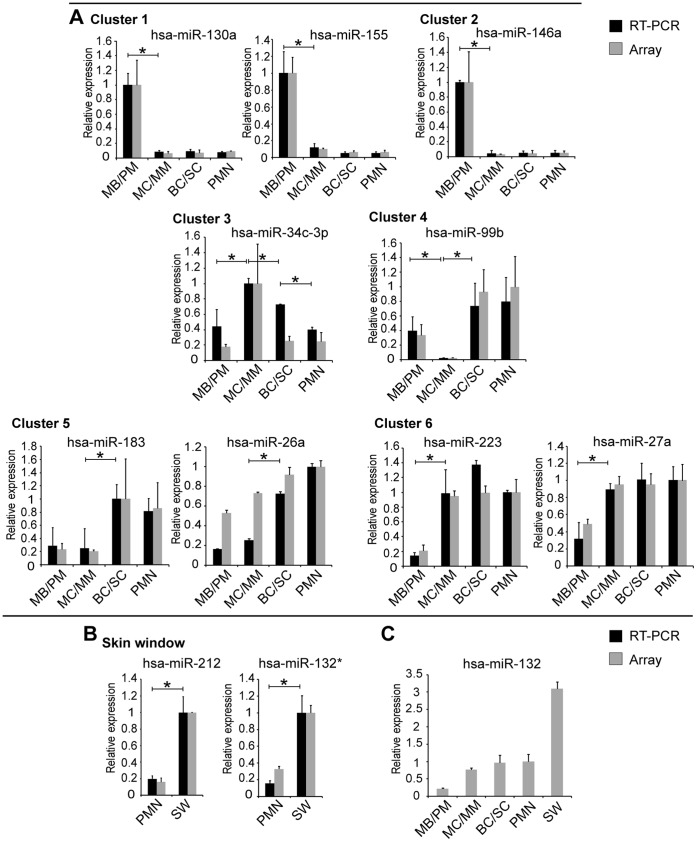
Figure 5. miRNA array data and real-time PCR verification.
The miRNA level measured by array analysis is represented by grey columns and the level measured by RT-PCR by black columns. An asterisk indicates a significant difference in expression between two populations (p<0.05) measured by real-time-PCR. A, Real-time-PCR verification of array analysis on selected miRNAs from the six clusters assigned to the miRNAs from bone marrow and peripheral blood PMNs. B, Quantitative real-time PCR verification of array analysis on selected miRNAs from PMNs and skin window PMNs. The relative expression level for each marker is shown relative to the cell population with highest expression, which is assigned the value 1. The real-time PCR data from each donor is measured in triplicates. C, Bar graph showing the schematic miR-132 expression during granulopoiesis and extravasation of PMNs based on array data. Different donors were used for the two different profiling studies. The PMN population has been assigned the value 1 to make the two measurements comparable. Error bars show the difference in expression (SD) between three donors.

