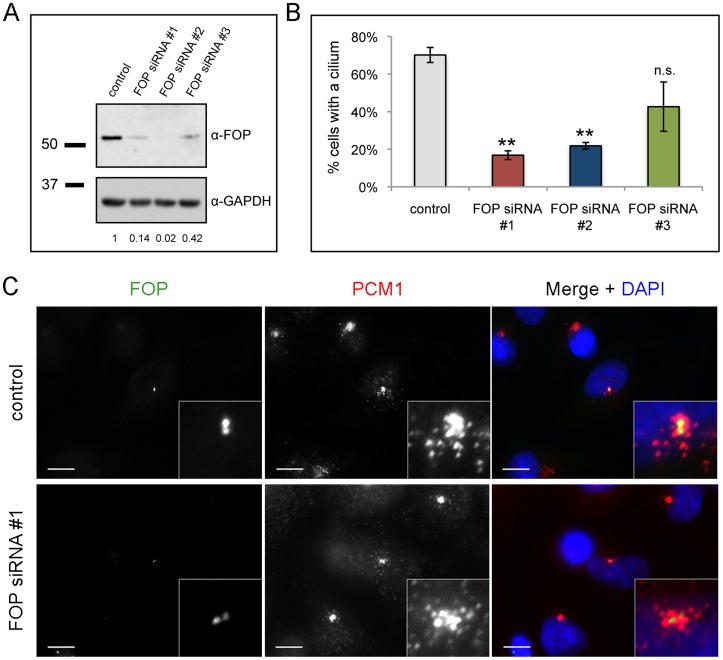
Figure 4. FOP depletion reduces frequency of ciliated cells.
(A) Western blot analysis of lysates from RPE-1 cells transfected with nontargeting (control) or FOP siRNA #1, #2, or #3. Relative FOP protein levels are calculated as the ratio of FOP/GAPDH for each lane, normalizing the control level to 1. (B) Quantification of percent of cells with cilia following transfection with control or one of three FOP siRNAs and serum starvation. Bars are mean ± SEM from three experiments, N = 200 cells per category per experiment. **p<0.05, n.s. not significant compared to control. (C) HeLa cells transfected with control or FOP siRNA, fixed, and stained with antibodies against FOP (green) and PCM-1 (red). DNA is stained using DAPI (blue). Scale bars: 10 µm; insets: 5× magnification.

