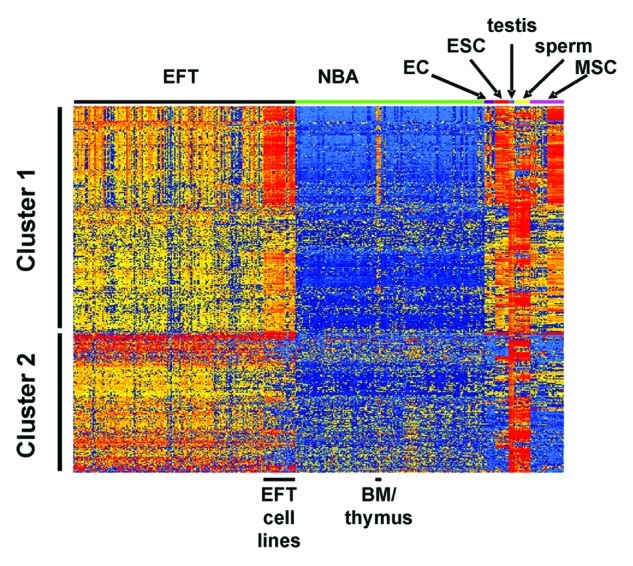
Figure 1. Expression pattern of EFT-associated CTA. EFT-associated CTA were identified as described in the text and used for cluster analysis (Manhattan distance, log2-transformed and median centered signal intensities). The positions of EFT samples and selected normal tissues (bone marrow (BM), endothelial cells (EC), embryonic stem cells (ESC), mesenchymal stem cells (MSC)) are indicated. The following GEO data sets were used: GSE8596, GSE12102, GSE17679, GSE34620, GSE34800, GSE36133, GSE3526, GSE9677, GSE6257, GSE8590, GSE22392, GSE26862, GSE6969, GSE8665, GSE9520 and GSE31215.
