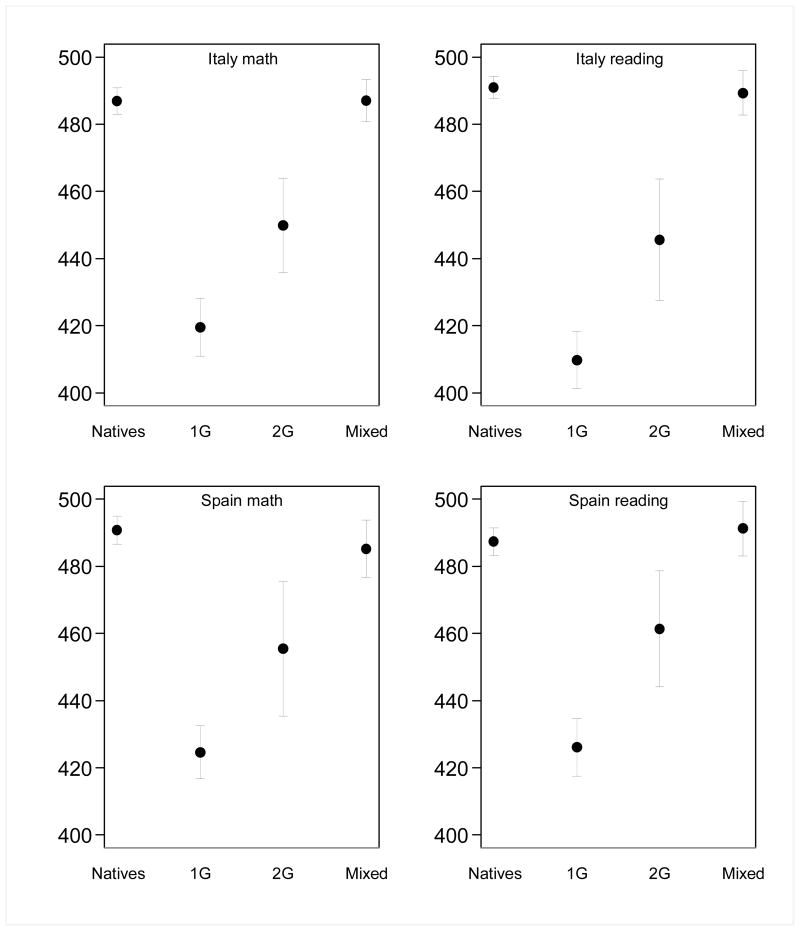
FIGURE 1. Mathematical and Reading Literacy of Natives and Children of Immigrants in Italy and Spain (PISA 2009).
Note: Mean scores of native, first generation (1G), second generation (2G), and mixed-parent students. Circles show point estimates calculated using final sampling weights and all five plausible values; lines show 95% confidence intervals calculated using all 80 replicate sampling weights and all five plausible values.

