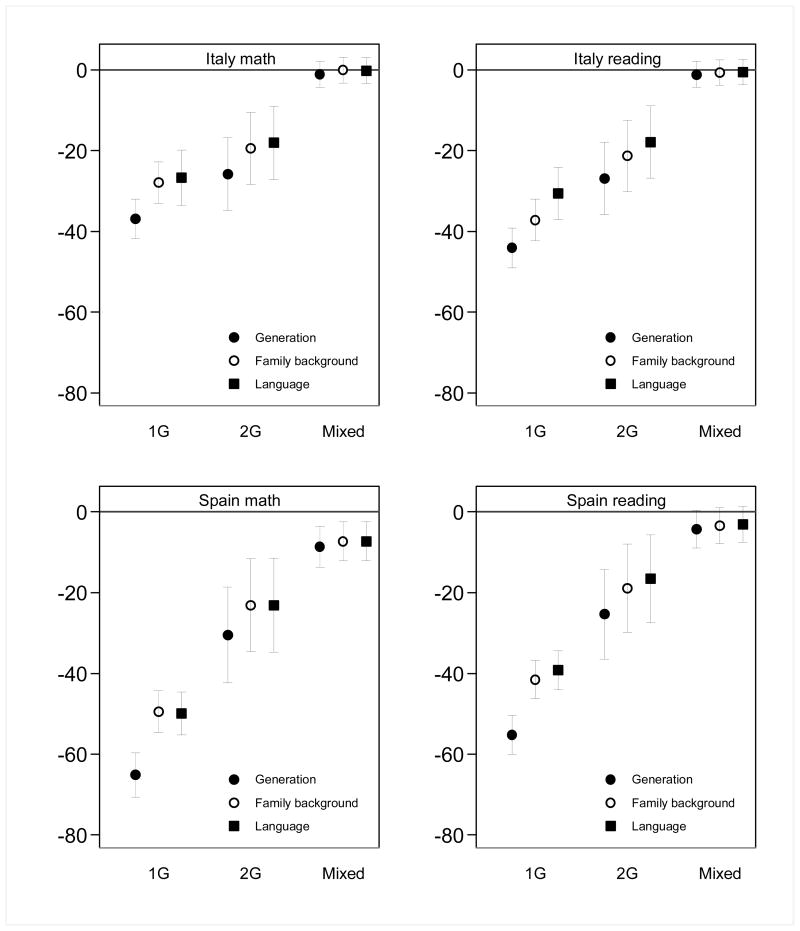
FIGURE 2. Achievement Gaps between Natives and Children of Immigrants in Mathematics and Reading Competences in Italy and Spain (PISA 2009).
Note: Estimated difference in score for first generation (1G), second generation (2G), and mixed-parent students as compared to natives in models 1 (closed circles), 2 (open circles), and 3 (squares) with 95% confidence intervals (lines). Model 1 includes immigrant generational status, age, sex, region (in the case of Italy) and area of residence as covariates. Model 2 incorporates the highest parental occupation and education, home possessions, and family structure. Model 3 adds language spoken at home. All models include school random intercepts, use all five plausible values and include student and school weights.

