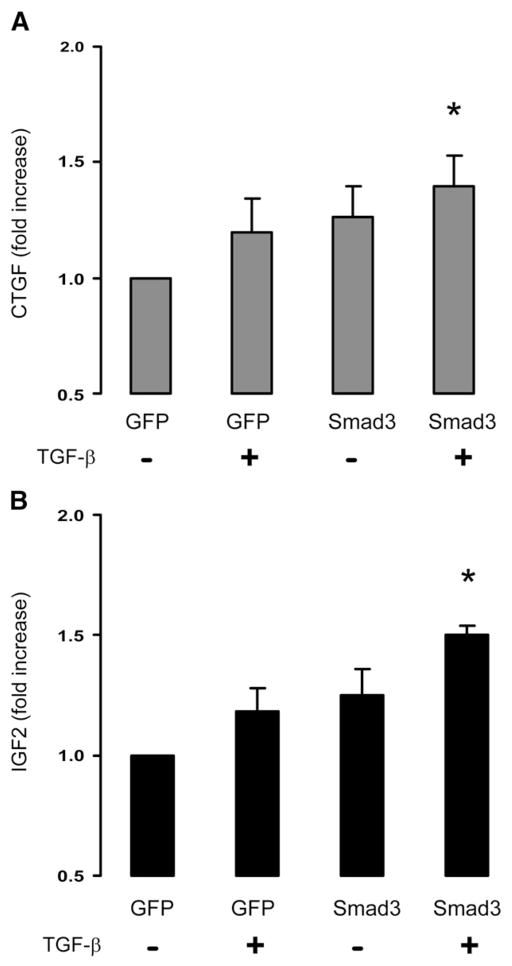
Fig. 3.
Measurement of CTGF and IGF2 in the conditioned media of the Smad3-expressing and TGF-β1-treated SMCs. Conditioned media from the GFP-expressing SMCs without (Bar 1) or with (Bar 2) TGF-β1 treatment, or from the Smad3-expressing SMCs without (Bar 3) or with (Bar 4) TGF-β1 treatment, were analyzed for secretion of CTGF (A) or IGF2 (B) by ELISA. Each bar represents a mean±SEM (at least 3 independent experiments). *p>0.05, as compared to GFP control.

