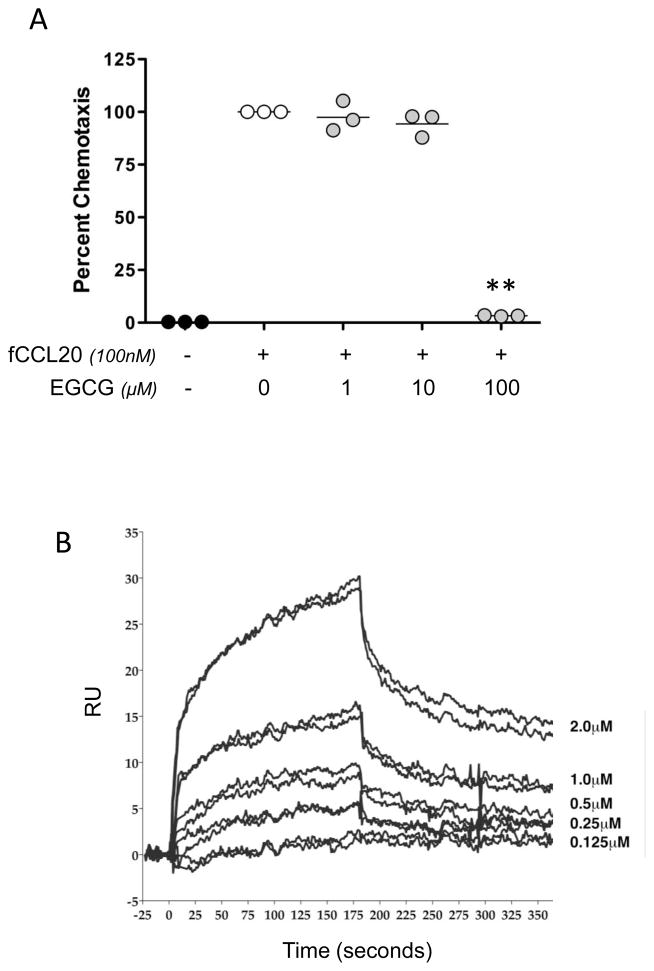
Fig. 5.
EGCG inhibits ferret CCL20. (A) Chemotaxis was performed toward synthetic fCCL20 (100nM) with or without co-incubation of EGCG (1, 10 or 100μM) on the bottom side of the membrane separating L1.2.fCCR6 cells from fCCL20. The data are presented as the percent of control chemotaxis (fCCL20 without co-incubation with EGCG), and were obtained from three independent experiments, each performed in triplicate. The lines in each grouping of data points represents the mean value. Paired t-test analyses were performed in comparison to the controls without EGCG and a P-value of <0.01 were observed with 100μM EGCG. (B) EGCG binding to fCCL20 was examined using SPR. Sensogram plots provide an indication of binding, response units (RU), over time where association is visualized as an increasing response, during which EGCG was owed over fCCL20. Dissociation is visualized as a decreasing response, during which the solution of EGCG flowing over the chip was replaced with buffer only. Two repeated dose-response curves of EGCG binding are shown for the indicated two-fold dilutions of EGCG that were injected over immobilized fCCL20.

