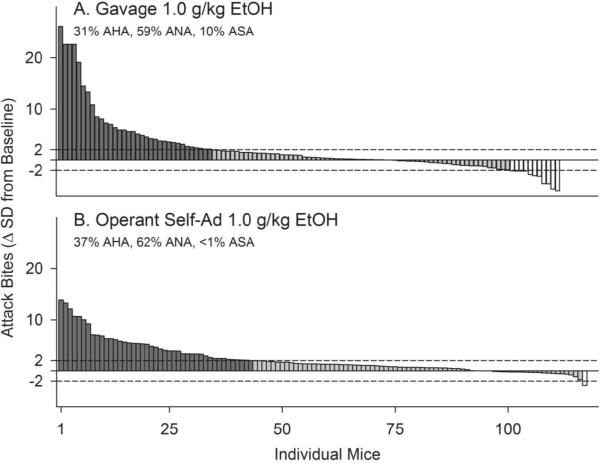
Figure 4.
Histogram representing the proportion and individual magnitude of alcohol-heightened aggression after gavage (A) or operant self-administration (B) of 1.0 g/kg alcohol. Dark vertical bars represent outbred CFW mice whose average frequency of attack bites after 1 g/kg alcohol exceeds their baseline levels of aggression by >2 SD (Alcohol-Heightened Aggression, or AHA). Gray vertical bars represent mice whose aggressive behavior is not significantly altered by 1 g /kg alcohol (Alcohol Non-heightened Aggression, or ANA), and white vertical bars represent mice whose aggressive behavior after 1 g/kg alcohol is reduced by >2 SD (Alcohol-Suppressed Aggression, or ASA). Dotted horizontal lines represent a 95% confidence interval, ±2 SD from average baseline.

