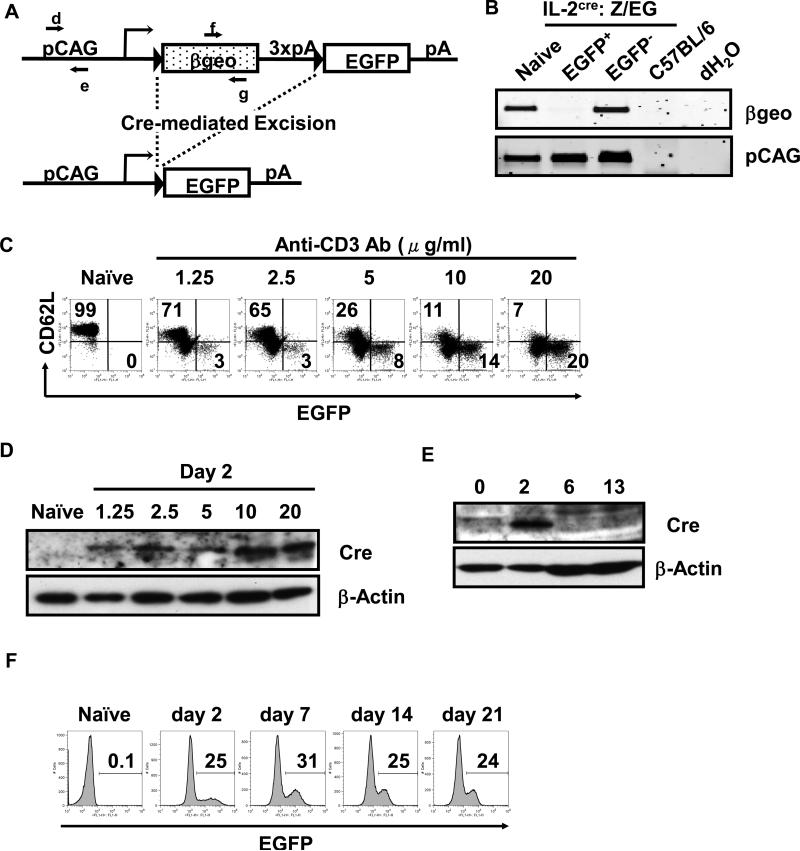
Figure 2. Cre-mediated homologous recombination in CD4 T cells from IL-2cre: Z/EG mice and expression of EGFP by activated T cells.
(A) A schematic representation of Z/EG (lacZ/EGFP) transgene. The Z/EG transgene consists of pCAG promoter (a hybrid promoter between cytomegalo virus (CMV) enhancer and chicken -actin promoter), a loxP-flanked geo (lacZ/neomycin-resistance) fusion gene, three SV40 polyadenylation sequences (3 x pA), and egfp gene. In the Z/EG mouse because the egfp gene is inserted downstream of the 3’ of the geo and 3x pA, EGFP will not be expressed until Cre excises the geo gene. When the il-2 promoter is activated, the Cre protein is produced and causes the deletion of the DNA fragment flanked by the loxP sequence via homologous recombination between two loxP sites, leading to expression of EGFP. The primers d and e are designed to detect pCAG promoter. The primers f and g are designed to detect geo. (B) PCR analysis of genomic DNA from EGFP+ T cells and control samples. Naïve CD62Lhigh CD4 T cells from IL-2-Cre: Z/EG mice were purified by sorting on a flow cytometer, stimulated with plate-bound anti-CD3 antibodies and soluble anti-CD28 antibodies for 2 days, and were cultured without further stimulation with exogenous IL-2 (10 ng/ml) for 11 days. These cells were then sorted into EGFP+ and EGFP- populations by flow cytometry, and were subjected to isolation of genomic DNA. The tail DNA of wild type C57BL/6 mice and dH2O only samples were used as negative control. Genomic DNA templates were subjected to PCR with primers f and g (shown in A) for detection of geo. The pCAG promoter fragment was amplified with primers d and e (shown in Fig. 2A) to show the amount of DNA used for the analysis. (C) Expression of EGFP by naïve or activated CD4 T cells. Naïve CD62Lhigh CD4 T cells were purified from IL-2cre: Z/EG mice and stimulated with graded doses of plate-bound anti-CD3 antibodies (at the concentration indicated above each panel) and soluble anti-CD28 antibodies (2 g/ml) for 2 days. The numbers indicate the percentage of cells within upper left (CD62L+ EGFP-) and lower right quadrant (CD62L- EGFP+) of the panel. (D) Western Blotting analysis of Cre expression by naïve or activated CD4 T cells. Naïve CD62Lhigh CD4 T cells from IL-2cre mice were stimulated with plate-bound anti-CD3 antibodies (concentrations indicated above each lane) and soluble anti-CD28 antibodies (2 g/ml) for 2 days. -actin blot was used as a loading control. (E) Time course analysis of Cre expression by activated CD4 T cells. Naïve CD62Lhigh CD4 T cells from IL-2cre: Z/EG mice were stimulated by plate-coated anti-CD3 antibodies (20 g/ml) and soluble anti-CD28 antibodies (2 g/ml) for 2 days and then cultured without stimulation in the presence of exogenous IL-2 for days shown above each lane (2~13 days). Total cell lysates were analyzed for the expression of the Cre protein. -actin blot was used to determine the level of protein loaded in each lane. (F) Time course analysis of EGFP expression by activated CD4 T cells. Naïve CD62Lhigh CD4 T cells isolated from IL-2cre: Z/EG mouse spleens were stimulated as in (C) for 2 days (day 2 sample). After this stimulation period, cells were removed from stimulation and maintained in the presence of exogenous IL-2. Cells were harvested 7, 14, or 21 days (as indicated above each panel) after start of initial stimulation and analyzed for EGFP expression by flow cytometry. The numbers indicate the percentage of EGFP+ among CD4+ cells.

