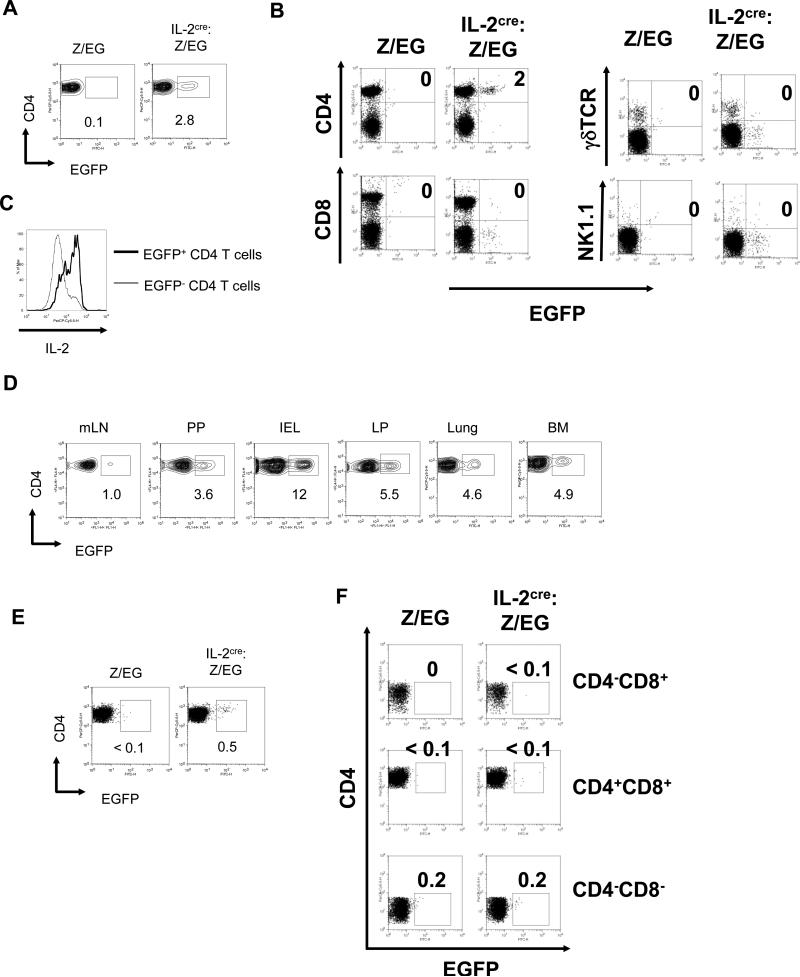
Figure 3. Presence of EGFP+ CD4 T cells in IL-2cre: Z/EG mice.
(A) Expression of EGFP by CD3+CD4+ cells in spleens from Z/EG control mice and IL-2cre: Z/EG mice. The numbers indicate the percent of cells within each gated region. (B) Expression of EGFP by different subset of lymphocytes from spleen of IL-2cre: Z/EG were analyzed by surface antigen staining for CD4, CD8, TCR, and NK1.1 as indicated. (C) Expression on IL-2 by EGFP- and EGFP+ CD4 T cells. Splenic CD4 T cells from IL-2cre: Z/EG were stimulated ex vivo by PMA and ionomycin for 4 hours. Expression of IL-2 was determined by intracellular staining and flow cytometry. (D) Expression of EGFP by CD3+CD4+ cells isolated from mesenteric lymph nodes (mLN), Peyer's patches (PP), intraepithelial lymphocyte of small intestine (IEL), and lamina propria of small intestine (LP), lung and bone marrow (BM) of IL-2cre: Z/EG mice. The numbers indicate the percent of cells within each gated region. (E) Expression of EGFP by CD4+ single positive thymocytes isolated from Z/EG control mice and IL-2cre: Z/EG mice. CD4+CD8- cells were gated by analysis software from total thymocytes and analyzed for EGFP expression. (F) Expression of EGFP by non-CD4+ CD8- thymocytes as analyzed in (E).

