
Fig. 1. Distribution of 232 M. sexta immunity-related genes.
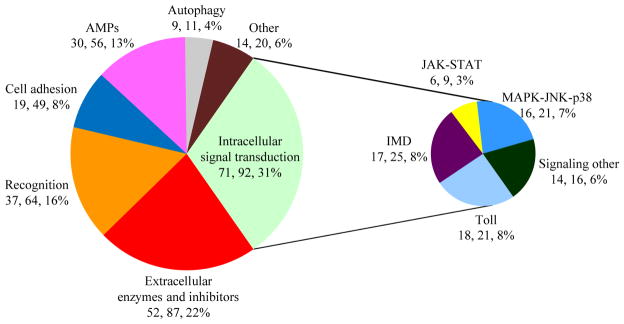
The pie chart shows gene number, contig number, and percentage of genes in each functional category relative to the entire set. The category of “intracellular signal transduction” is further divided into pathways (right).