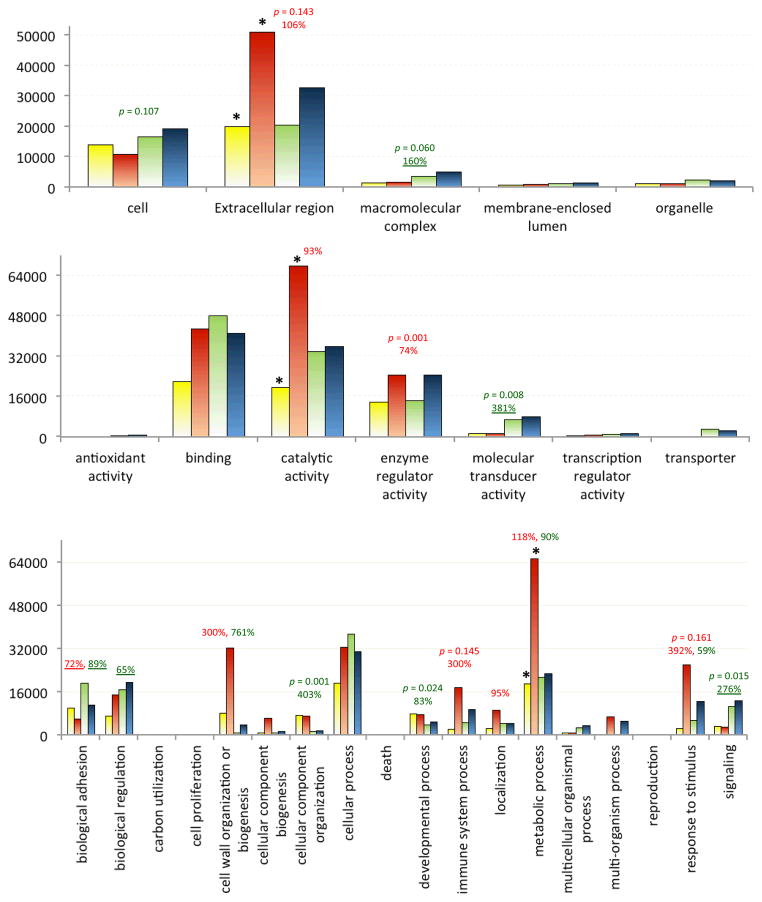
Fig. 2. Expression analysis of cellular components (CC, top), molecular functions (MF, middle), and biological processes (BP, bottom) at GO level 2.
The bar graph is generated using data from the sum of NRNs for each annotated gene. Each GO term is comprised of four values, each from a particular library (CF: yellow, IF, orange, CH: green, and IH: blue). Bar height represents sum of sums of NRNs in a library within a specific GO group. p value (< 0.20) and percentage (>50%) increase or decrease (underlined) of immune inducibility (red, IF-IH vs. CF-CH) and tissue specificity (green, CF-IF vs. CH-IH) are indicated on the top. Of the eleven GO categories in which NRN sums have >50% differences in either or both tissues, three increase most dramatically and are marked with “*”.

