Figure 2.
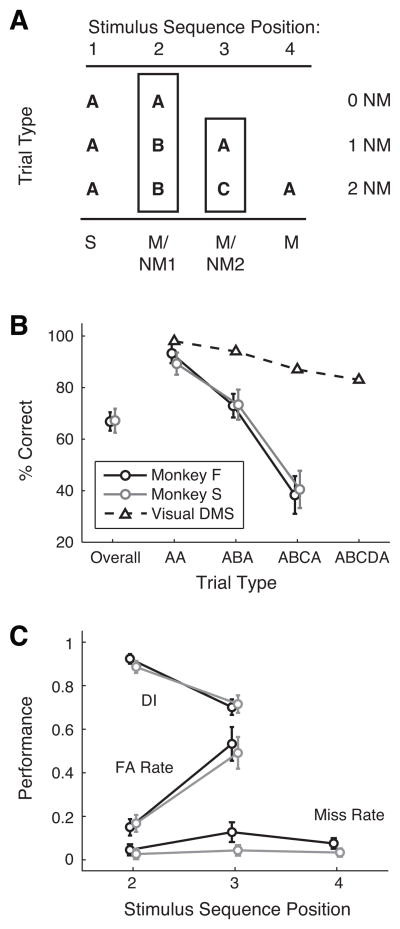
(A) Schematic diagram of stimulus sequence positions (numbered across the top), and the stimulus conditions that may appear within the three trial types (AA, ABA, and ABCA, corresponding to zero, one, or two nonmatch stimuli). The stimulus at position 1 is always the sample (S); stimuli at positions 2 and 3 may be a match (M) or a nonmatch (NM1, NM2); position 4 is always a match. (B) Percent correct (mean ±SD) for all trials (Overall, at left) and for the three trial types (AA, ABA, and ABCA, at right). Black symbols represent monkey F (N = 360 sessions, > 250,000 trials); gray symbols represent monkey S (N = 116 sessions, > 82,000 trials). For comparison, performance on an analogous visual DMS task is overlaid (open triangles and dashed line; from Miller et al., 1993). (C) Performance measured by DI, FA rate, and miss rate, computed separately at each position within the trial sequence. All three metrics take a value between 0 and 1 and share the same ordinate. FA rate and DI are not computed for the stimulus at position 4, as it is always a match, and so no FA can occur. FA rate increases sharply between stimulus positions 2 and 3 for both monkey F (black) and monkey S (gray).

