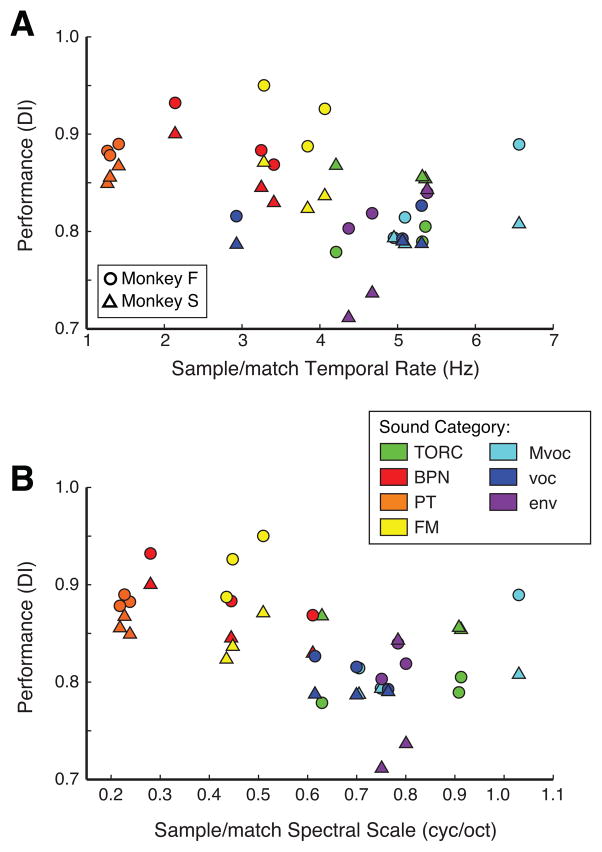
Figure 3.
Performance (DI) compared directly to temporal rate (A) and spectral scale (B) confirms that performance decreases as sample sound complexity increases. Circles represent data from monkey F, triangles, from monkey S. Colors indicate the experimenter-defined “categories”, where hot colors indicate simple synthetic stimuli, and cool colors indicate complex natural stimuli. The negative correlation of performance with complexity is significant (p ≤ 0.05) by linear regression in all cases.

