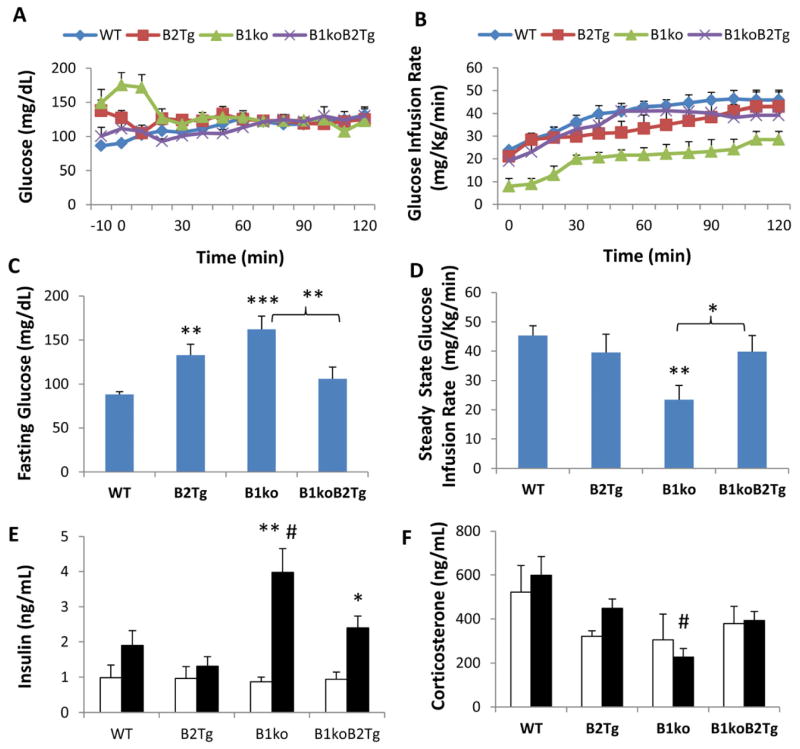
Fig. 2.
Hyperinsulinemic-euglycemic clamps on mice at 25 h in dim red light (= CT13 for WT, B2Tg, and B1ko/B2Tg mice). Arterial glucose levels (A) and glucose infusion rates (B) during insulin clamps for wild-type (WT), Bmal2 transgenic (B2Tg), Bmal1 knockout (B1ko), and Bmal1ko/Bmal2Tg (B1koB2Tg) mice. (C) arterial glucose levels for mice subjected to a 5-h fast (average of times -10 min and 0 min prior to the initiation of insulin infusion). (D) glucose infusion rates during the last 50 minutes of the clamps. Arterial insulin (E) and corticosterone (F) levels during the clamps (Open bars: Basal, Solid bars: Clamp period). Data are shown as mean ± SEM (4–7 mice per group), *p < 0.05, **p < 0.01, ***p < 0.001 compared with WT mice (panels C&D, one-way ANOVA with LSD), compared with basal levels (panels E&F, two-tail unpaired T test). # p< 0.05 compared among four genotypes (one-way ANOVA). Insulin (p < 0.001) but not corticosterone (p=0.557) levels between the basal and clamp conditions were significantly different among the four genotypes as analyzed by two-way ANOVA. Statistically significant differences among the four genotypes were revealed by one-way ANOVA for both clamp insulin levels (p = 0.011, high in B1ko) and clamp corticosterone levels (p = 0.016, lower in B1ko). Two-way ANOVA analyses of strain X phase interaction indicated a significant difference for insulin levels (p = 0.013), but not for corticosterone levels (p = 0.674).

