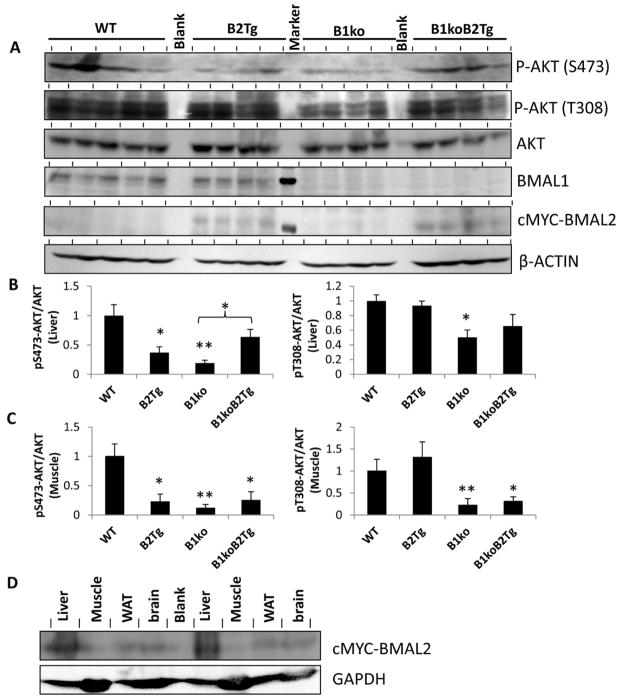
Fig. 3.
Regulation of AKT pathway signaling by Bmal1/2. (A) Immunoblots from liver extracts for phospho-AKT (p-AKT S473 and T308), AKT (total), BMAL1, cMYC-BMAL2 (cMYC-tagged BMAL2 is the version of BMAL2 expressed in the B2Tg and B1ko/B2Tg mice, ref. 16), and β-ACTIN of mice after hyperinsulinemic-euglycemic clamps. Each lane comes from a separate mouse (n = 5 for WT, n = 4 for the other groups). The lane between the B2Tg and the B1ko samples in the BMAL1 and cMYC-BMAL2 blots shows a molecular weight standard indicating 75 kD. (B) Densitometric analyses of the data shown in panel A for liver extracts. Expression of AKT-pS473 and AKT-pT308 were normalized to total AKT. (C) Densitometric analyses of the data for muscle extracts analyzed and plotted as in panel B (see Fig. S2 for the raw immunoblot data). For panels B and C, the value of WT was set as 1.0, and values are expressed as mean ± SEM of integrated intensity. (D) Expression of cMYC-BMAL2 in various tissues of B1ko/B2Tg mice. Results from two representative mice are shown for liver, muscle, white adipose tissue (WAT) and brain tissues. The blot for cMYC-BMAL2 (upper blot) is compared with a blot for a control protein (GAPDH, lower blot). In all panels, *p < 0.05, ** p < 0.01 compared with WT or as indicated.

