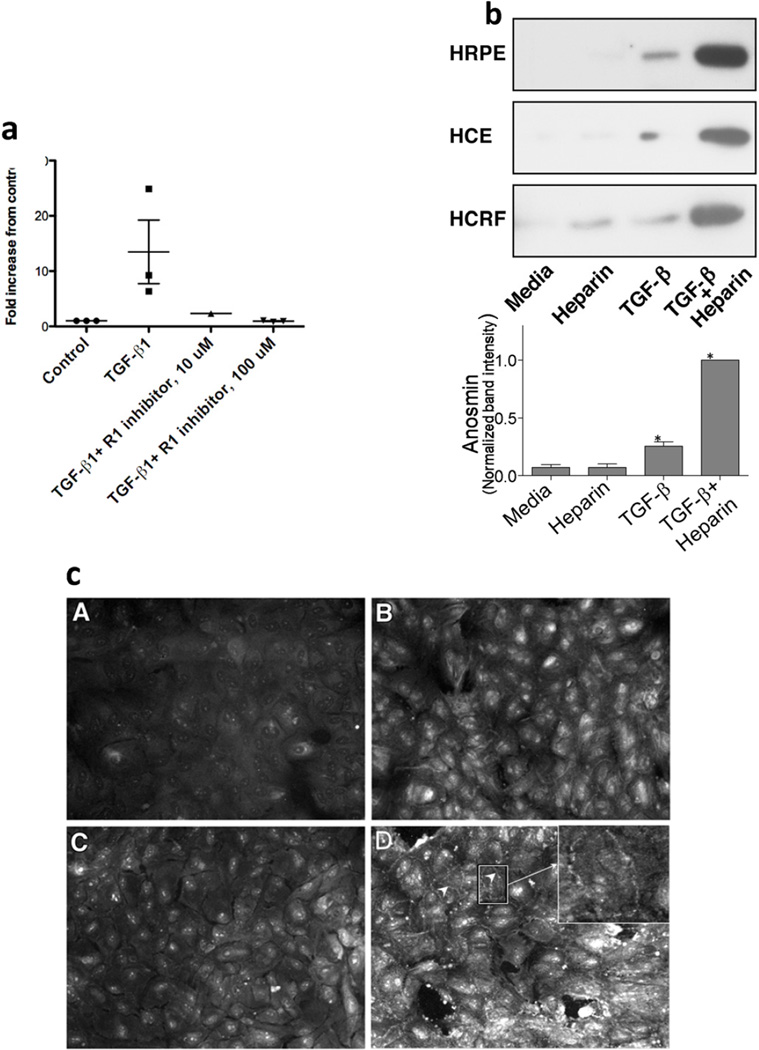
Fig. 1.
a. Real-time PCR analysis of KAL-1 gene expression in HRPE cells treated with TGF-β1. HRPE cultures were treated with TGF-β1 (10 ng/ml) in the absence or presence of TGF-β receptor 1 inhibitors for 8 h. Total RNA prepared was used for Real time PCR analysis as described in the methods.
b. Immunoblot analysis of anosmin (KAL-1) secreted by cell cultures. Cultures grown to confluence were treated without or with TGF-β (10 ng/ml) for 24 h in serum free media. Two hr before harvesting, heparin was added to give 50 ug/ml concentration. Culture supernatants collected were concentrated 50 fold and used for immunoblot analysis as described in the methods section. HRPE, Human retinal pigment epithelial cells; HCE, Human corneal epithelial cells; HCRF, Human corneal fibroblast cells. In repeated experiments the molecular size of anosmin appeared around 75kD. Lower panel: Anosmin-1 level in the culture supernatant was quantified by Western blot, in four separate experiments using HRPE cells. Band intensities were normalized to the intensity of the sample with highest anosmin-1 level and expressed as mean+standard error. *=p<0.05 when compared to the controls.
c. Immunofluorescence detection of Anosmin (KAL-1) in HRPE cells. HRPE cultures grown to confluence in 8 well glass slides were treated with TGF-β for 24 hr, fixed, incubated with pre-immune serum or rabbit polyclonal antibody followed by FITC conjugated secondary antibody. A. Control cells incubated with pre-immune serum; B. Control cells incubated with anosmin-1 antibody; C. TGF-β treated cells incubated with pre-immune serum; D. TGF-β treated cells incubated with Anosmin antibody (arrow heads indicate intercellular staining)

