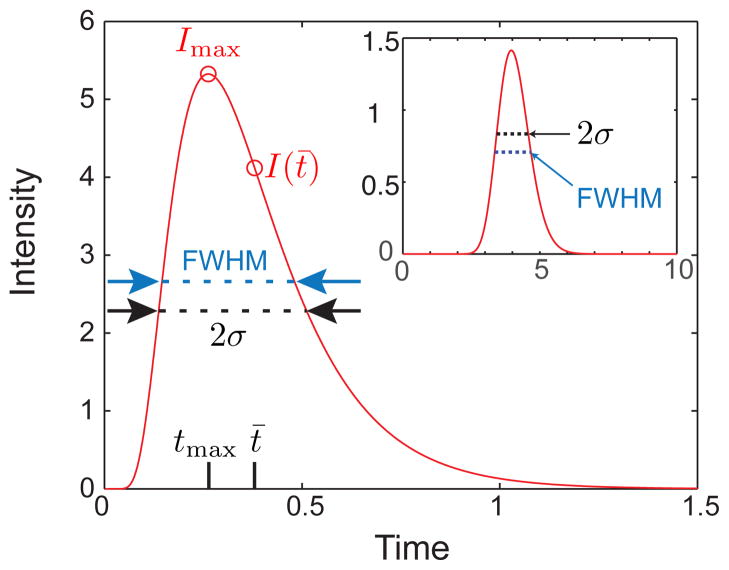
Figure 14.
Finish line detection of a Gaussian function with unit mass, Ū = 0.5, and D̄ = 0.01 at position L = 0.15. The velocity and dispersion coefficient are identical to Figure 13. The maximum value of the concentration, Imax, the variance, σ, the full width half maximum (FWHM), and the location of the concentration at the mean elution time, I(t̄), are indicated. The inset shows the same Gaussian peak measured at L = 2.

