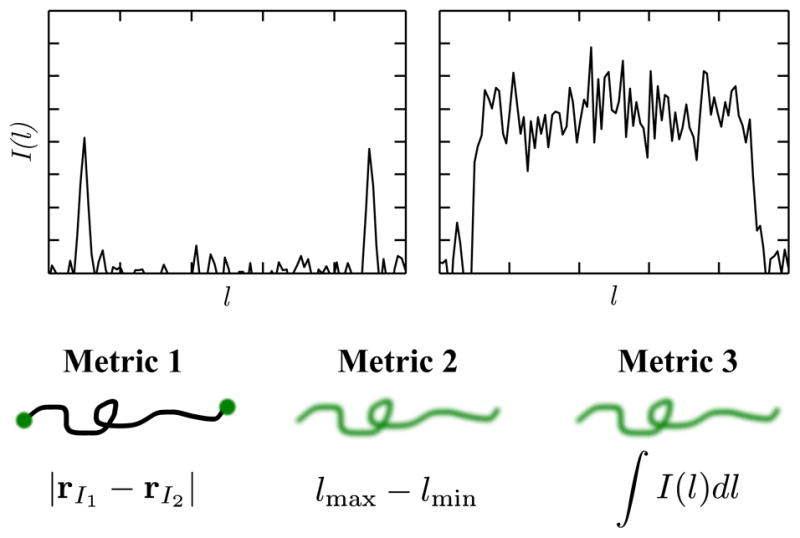
Figure 18.

Three different methods to obtain a measure of genomic length using fluorescence microscopy: (1) Probe-probe distance, (2) extension, (3) integrated intensity. Plots show simulated fluorescence profiles for probes (left) and for intercalating dyes (right). The area under the curve on the right gives the total fluorescence intensity.
