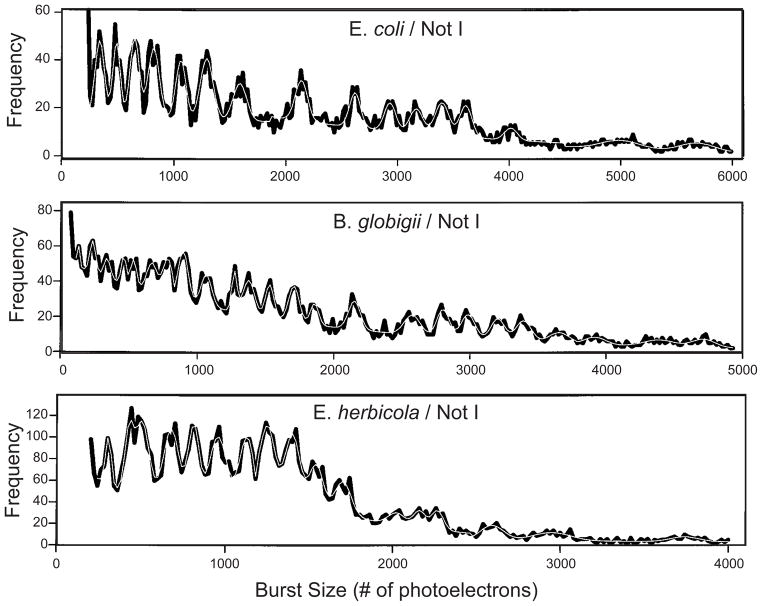
Figure 72.
Flow cytometry burst histograms for the NotI fingerprints of three different organisms. The black lines are the raw data and the white lines are the sum of Gaussian fits to the data. Adapted with permission from Ref.99 Copyright 1999 Wiley-Liss, Inc.

