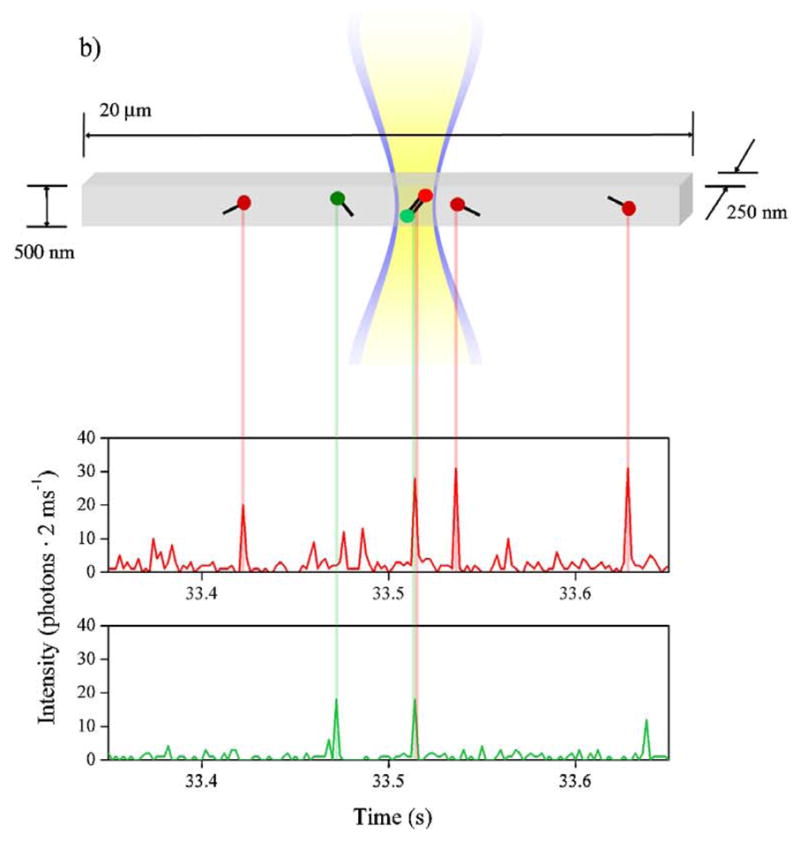
Figure 73.

Illustration of the principle of two color analysis of DNA in cytometry device. These particular experiments were performed in a submicron channel using electrophoretic cytometry, which is discussed in more detail in Section 8.2. Reprinted with permission from Ref.735 Copyright 2007 American Institute of Physics.
