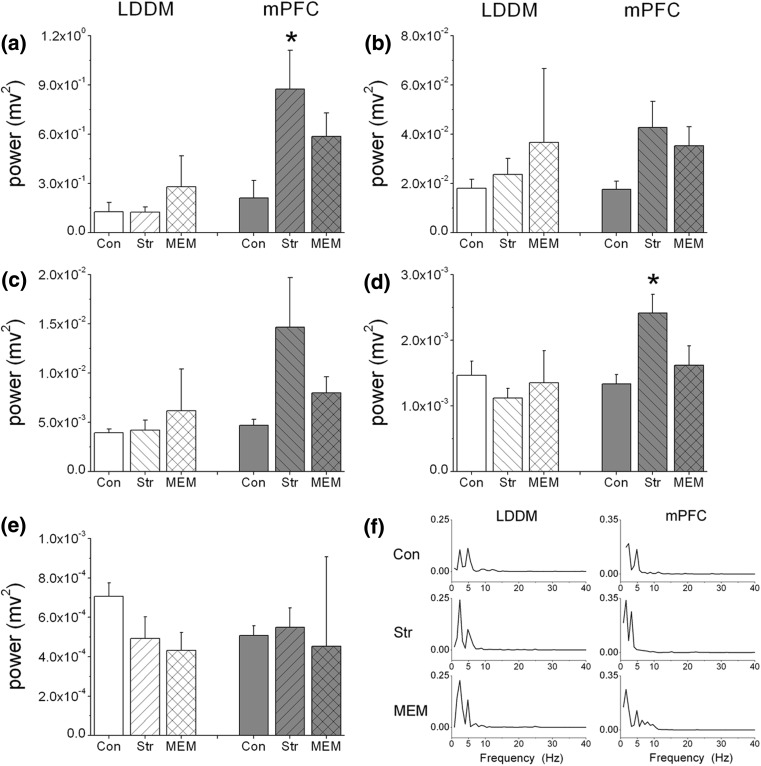
Fig. 1.
Mean power spectra of local field potentials from 1 to 40 Hz across five frequency bands and the spectra of several representative signals in thalamus and prefrontal cortex among Con, Str and MEM groups. a–e Comparison of LFP power spectra at delta (1–4 Hz), theta (4–8 Hz), alpha (8–15 Hz), beta (15–30 Hz) and slow gamma (30–40 Hz) frequency bands among these three groups (n = 6). Powers of thalamus (left) and mPFC (right) were showed respectively. Error bars indicate SEM, *p < 0.05 for comparisons among these three groups in mPFC. f Examples of power spectra in one normal rat (Con, in upper panel), one stressed rat (Str, middle panel) and one stressed + memantine treated rat (MEM, lower panel) at both LDDM and mPFC regions. Y-axis refers to the absolute power spectrum and the unit is mv2

