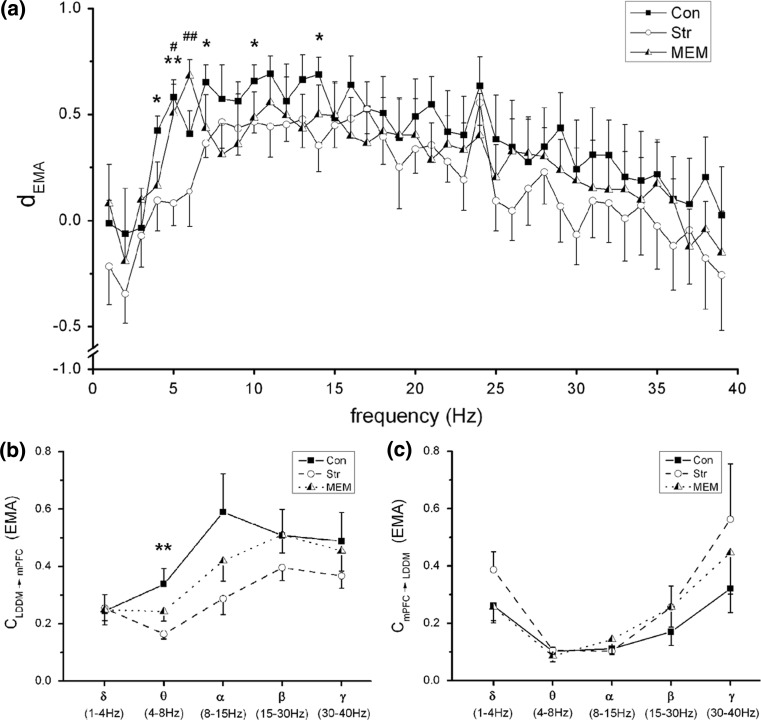
Fig. 3.
The coupling direction index  and c. a
 varied with frequency from 1 to 40 Hz (n = 6) from LDDM to mPFC. *p < 0.05 and **p < 0.01 between Con and Str groups and #p < 0.05 and ##p < 0.01 between Str and MEM groups. The unidirectional phase–phase coupling indices between LDDM and mPFC: b
 (forward) and c
 (backward) at five rhyrhms. **p < 0.01 between Con and Str groups

