
Figure 3.
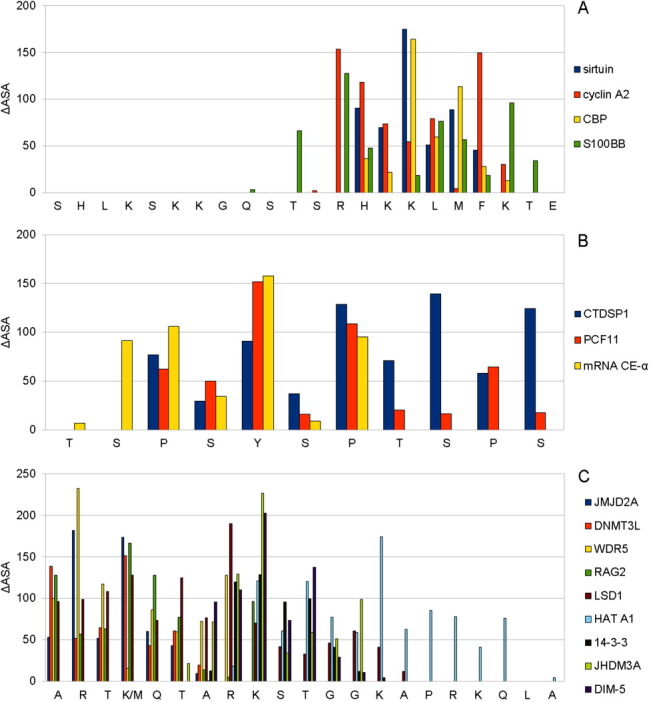
The profiles of solvent surface area changes within three selected MoRF clusters with structurally different partners: (A) p53, (B) RNAP II, and (C) H3. The Y axis gives the change in surface area of each entire residue upon binding, whereas the X axis gives the residues. [Color figure can be viewed in the online issue, which is available at wileyonlinelibrary.com.]