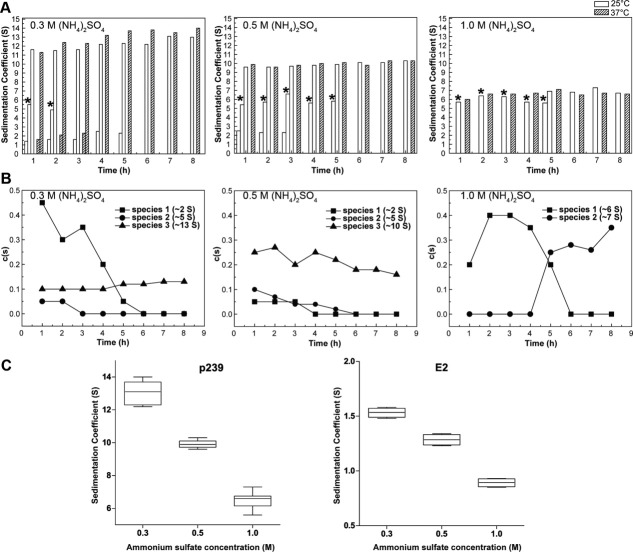
Figure 4.
Time-scale sedimentation coefficient distribution analysis of p239 with treatments of (NH4)2SO4. The components of the p239 treatments are shown in histogram form (A), and the two column types representing the components at 25°C and 37°C are labeled. The concentration of (NH4)2SO4 is also labeled. The c(s) distribution of the different species that were present following the 25°C incubation is shown in a line and symbol form (B). The sedimentation coefficient distributions of p239 and E2 following different (NH4)2SO4 treatments are shown in a box chart (C). *, assembly intermediates with sedimentation coefficient around 5 S.

