Figure 2.
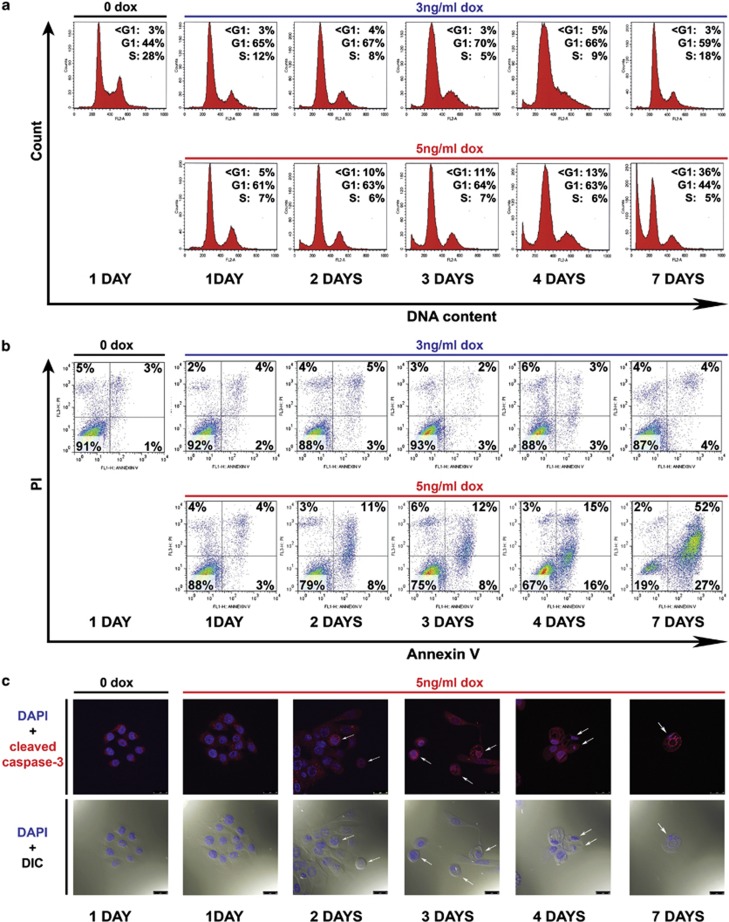
The level of p53 in B5/589-p53 cells determines the cell fate decision between G1 cell cycle arrest and apoptosis. (a) Flow cytometry analysis of DNA content by PI staining of B5/589-p53 cells induced with 3 or 5 ng/ml doxycycline (dox) for 1, 2, 3, 4 and 7 days. Control cells were cultured without doxycycline (0 dox) for 1 day. (b) Flow cytometry analysis of apoptosis by Annexin V/PI staining of the same B5/589-p53 cells described in (a). (c) Confocal analysis of B5/589-p53 cells that were uninduced (0 dox) for 1 day or induced with 5 ng/ml dox for 1, 2, 3, 4 and 7 days. Blue, DAPI (4′,6-diamidino-2-phenylindole) nuclear staining. Red, cleaved caspase-3 staining. DIC (differential interference contrast microscopy) morphology was also photographed by the confocal microscope. White arrows point to examples of cell shrinkage (5 ng dox – 2 days; 5 ng dox – 3 days (left)), cytoplasm vacuolization (5ng dox – 3 days (middle and right)), pyknotic and fragmented nuclei (5 ng dox – 4 and 7 days). Magnification, × 63; scale bar, 25μm

