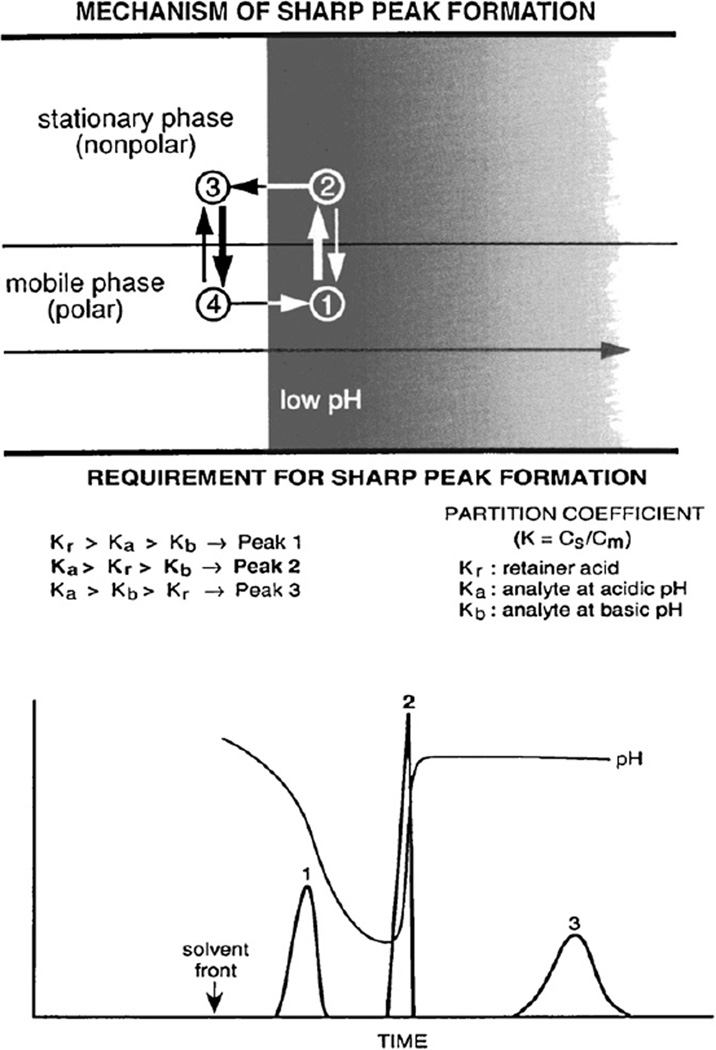
Fig. 3.
Schematic illustration of the peak sharpening process in the separation column and general requirement of sharp peak formation. Upper diagram shows a portion of the separation column that contains organic stationary phase in the upper half and aqueous mobile phase in the lower half. The acid present in the sample solution forms a sharp trailing border around which the solute molecules circulate by repeated protonation (on the right side) and deprotonation (on the left side) to form a sharp peak as described in the text. The lower diagram shows the requirement for sharp peak formation. Peak 1 is obtained when both Ka and Kb are smaller than Kr, while peak 3 is obtained when both Ka and Kb are greater than Kr. Sharp peak 2 is only formed when Kr falls between Ka and Kb, as indicated in the figure.

