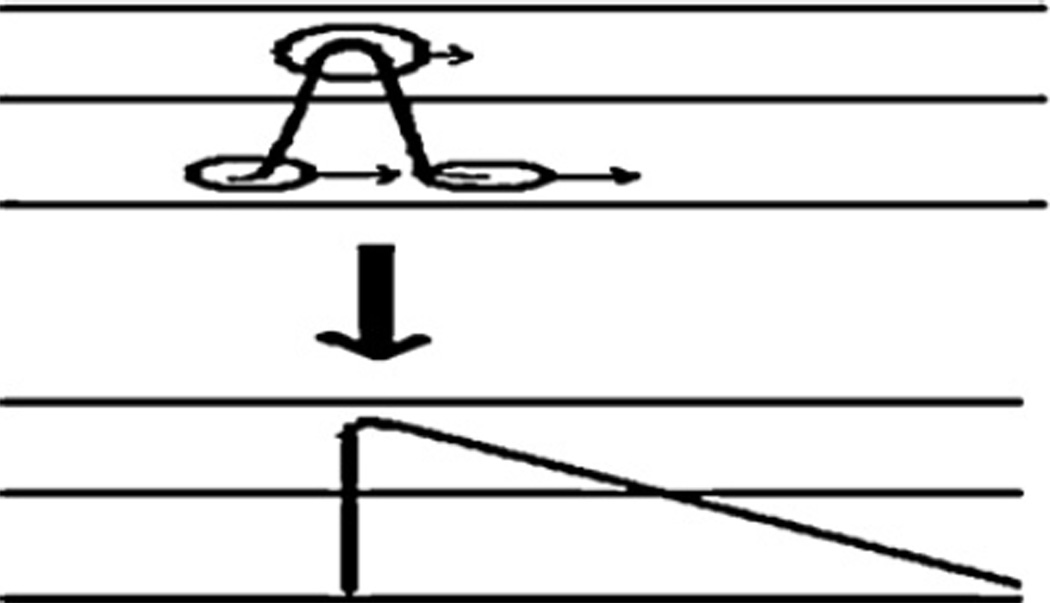
Fig. 6.
Mechanism of formation of a sharp acid trailing border in the column due to non-linear isotherm. Upper diagram illustrates the Gaussian distribution of the acid at the beginning portion of the column where the concentrated upper portion of the peak is more distributed in the stationary phase and moves at a lower rate while the dilute foot of the peak is more distributed into the lower mobile phase and moves faster making a skewed peak distribution as shown in the lower diagram.

