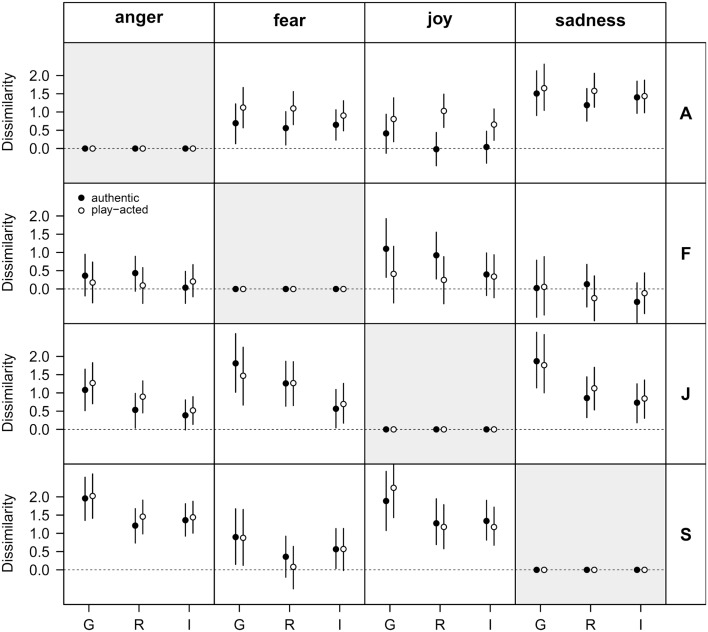
Figure 5.
Analysis of emotion recognition data using choice theory. Given is the dissimilarity for different pairs of emotion stimuli with respect to cultural affiliation (G – Germany, R – Romania, I – Indonesia). The rows and columns of this matrix plot indicate the four emotion stimuli (A – anger, F – fear, J – joy, S – sadness) and the four possible responses (anger, fear, joy, sadness), respectively. Filled and open symbols refer to authentic and play-acted conditions, respectively. Data are given as means and 95% uncertainty interval. The dissimilarity describes how well each stimulus (depicted by rows) is discriminated from each other stimulus (depicted by response columns).

