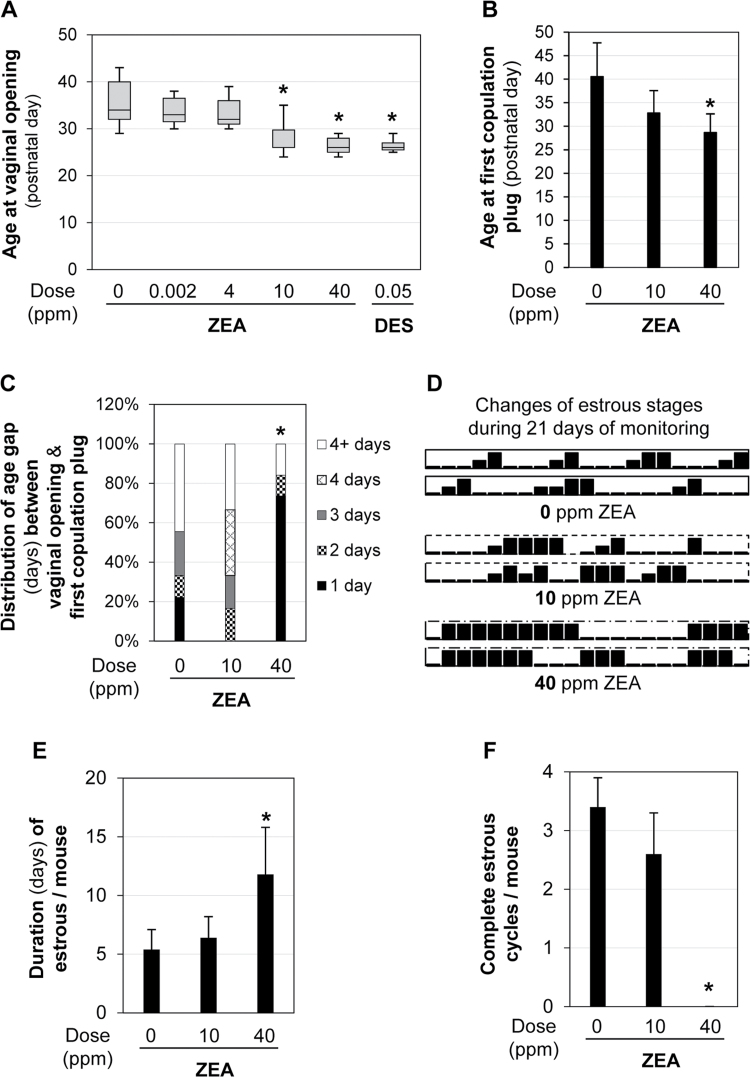
Fig. 2.
Postweaning exposure to dietary ZEA on puberty and estrous cycle. (A) The average age at VO in each group. N = 11–50. Error bars: SD. *p < 0.05 compared with 0 ppm ZEA control group. (B) The average age at first copulation plug. Error bars: SD. *p < 0.05 compared with 0 ppm ZEA-treated group. (C) Distribution of age gap (days) between VO and first copulation plug. *p = 0.0166, percentage of mice with 1-day gap. (B and C) N = 9 (0 ppm ZEA), N = 6 (10 ppm ZEA), and N = 19 (40 ppm ZEA). (D–F) Estrous cyclicity of five 6-week-old mice each in 0, 10, and 40 ppm ZEA groups for 3 weeks. (D) Estrous cyclicity of two representative mice in 0, 10, and 40 ppm ZEA-treated groups during 21 days of monitoring. High bar, estrous stage; median bar, proestrus; low bar, diestrus/metestrus. (E) Duration (days) of estrous per mouse during the 21 days of monitoring in 0, 10, and 40 ppm ZEA-treated groups. *p = 0.0008 compared with 0 ppm ZEA-treated group. (F) The number of complete estrous cycles per mouse in each group during the 21 days of monitoring. *p < 0.05 compared with 0 ppm ZEA-treated group. (E and F) N = 5 in each group. Error bars: SD.

