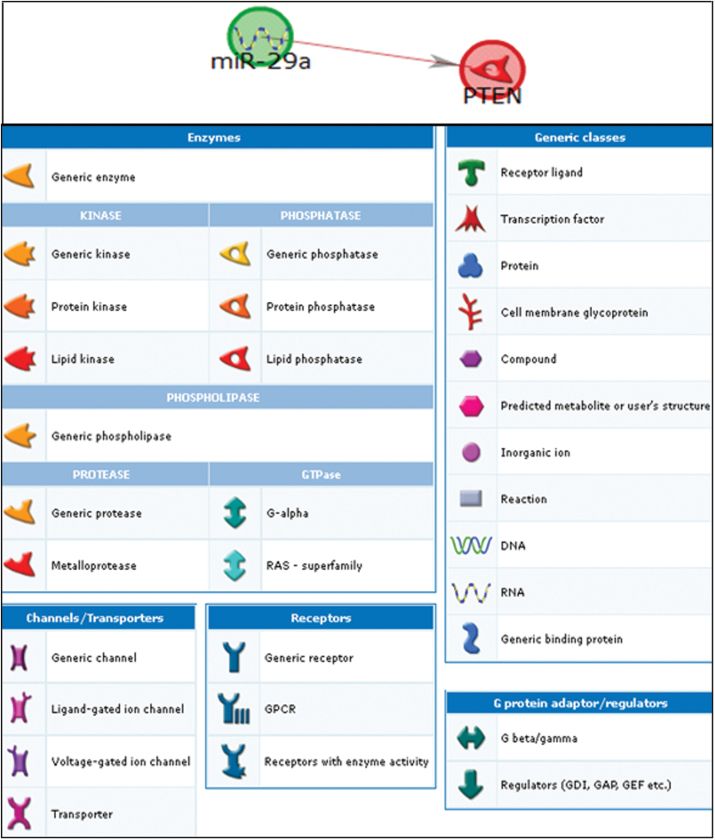
Fig. 1.
Network analysis showing the pathways linking miR-29a and PTEN. The annotations of symbols and abbreviations in the regulatory network are shown. Individual miRNAs and genes are represented as nodes; the different shapes represent the functional class of genes. The arrow heads indicate the direction of the predicted interaction. Green lines represent upregulation and red lines represent downregulation. Gray lines represent an unspecified effect. Known targets are highlighted in blue.

