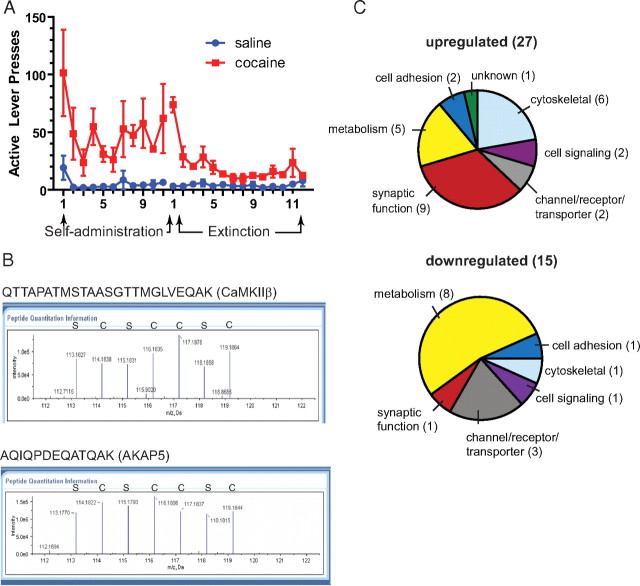
Figure 1.
Summary of iTRAQ proteomic results. A, Active lever presses for cocaine and yoked saline controls used for proteomic analysis (n = 4 for each group). B, Representative MS spectra profile for selected identified peptides from CaMKIIβ and AKAP5. Peaks were derived from yoked saline (S) or cocaine-trained (C) animals. Peak height indicates the relative abundance of the isobaric tag in that sample. C, Categorization of proteins whose levels were significantly upregulated or downregulated after cocaine self-administration and extinction training.

