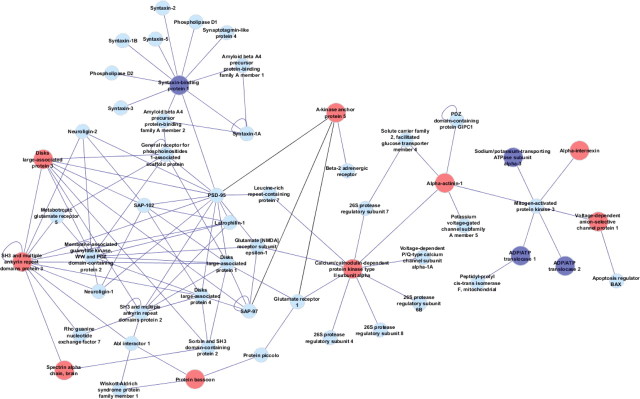
Figure 2.
Protein network analysis using Cytoscape reveals upregulation in proteins associated with glutamatergic signaling. Upregulated proteins are indicated by red circles and downregulated proteins by dark blue circles. Additional interacting proteins are indicated by light blue font. This network analysis reveals linkage of AKAP5 with PSD scaffolding proteins and most immediately with upregulated CaMKII.

