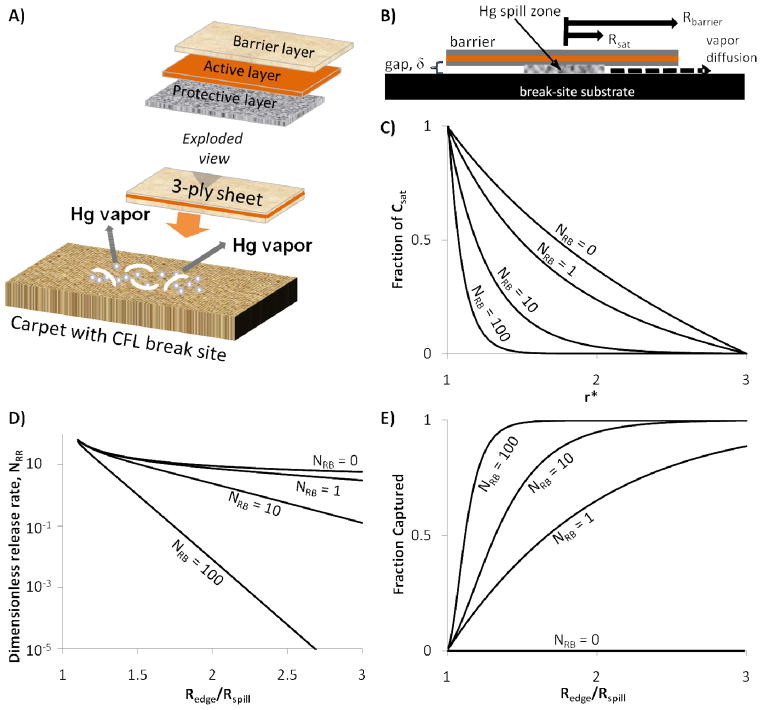
Figure 3.
Formulation and prediction of a coupled reaction and transport model of the reactive barrier technology applied to fluorescent lamp break sites. A) Exploded view of reactive barrier concept, B) Model formulation, C) Example Hg concentration profiles under a barrier three times the size of the spill, D) Release rates as a function of the dimensionless barrier number, NRB, and ratio of reactive barrier size Redge to spill size Rspill, E) Predictions of the fraction captioned of the mercury leaving the saturated zone.

