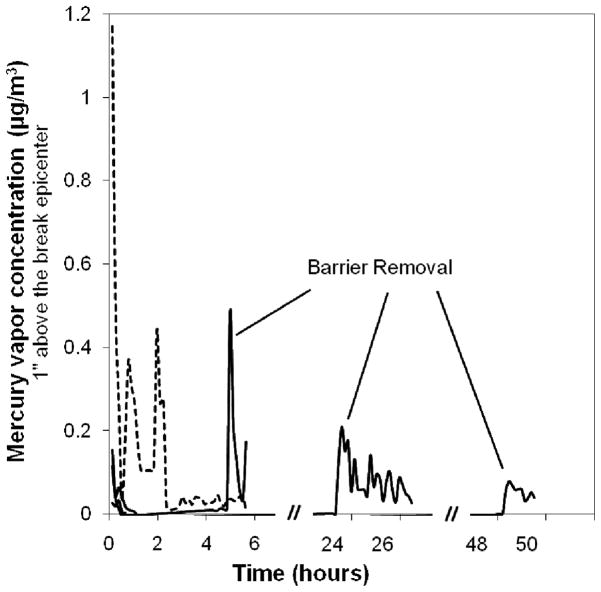
Figure 5.
Mercury vapor concentrations 1 inch above the epicenter of CFL break sites in an open laboratory with (solid curves) and without (dashed curve) treatment by coverage with a 5 mg nSe reactive barrier. The curve segments at 5, 24, and 48 hrs show the effects of barrier removal. The use of the reactive barrier for at least 48 hrs suppresses almost all of the Hg vapor released to the indoor space.

