Figure 3.
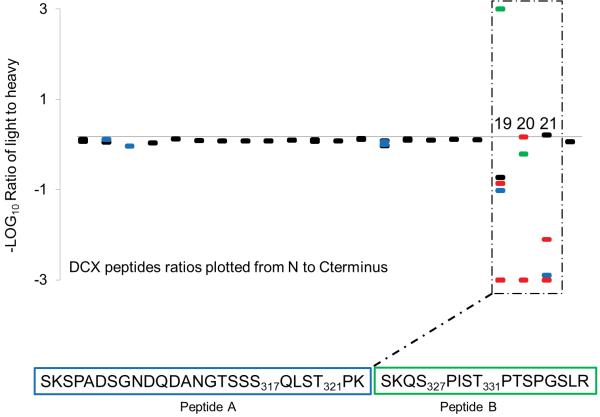
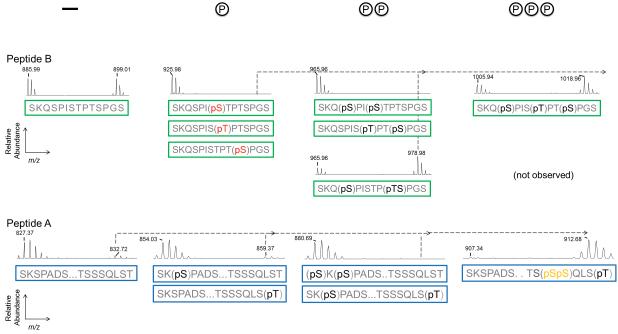
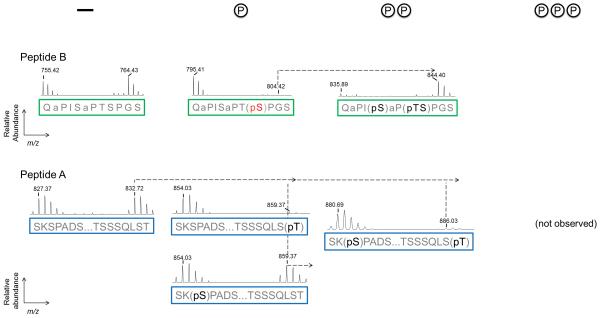
FLEXIQinase analysis of JNK/GSK3β activity on DCX. (a) A plot of the light/heavy ratios of WT DCX tryptic peptides 1-22 (18-22 are labeled and amino acids within 19 to 21 are indicated) – how do the three tryptic peptides correlated to Peptide A and B? what is the significance of peptides 18 and 22; why are they labeled?. Unmodified peptides plots are black, singly phosphorylated peptides are blue, doubly phosphorylated peptides are red, and triply phosphorylated peptides are green. (b, c) Peak chase profile for peptides A and B for WT (b) and mutant (c) DCX. The phosphorylation status is profiled on top where a dash indicates an unmodified peptide, and the number of (P’s) indicate the number of phosphorylation sites on the peptides below. Representative light-to-heavy peak profiles [label the axis, indicating real numbers for m/z since this is real data not schemata] are shown for the phosphorylation sites indicated below them. Green and blue boxes include all possible phospho-acceptor sites for peptides B and A, respectively, a simplified view of the tryptic peptides in (a) which peptides in (a) do these correspond to, please give the number. Dashed lines connect heavy substrate peaks with their expected heavy product peaks, until an end product is observed. A product peak that should be present but not observed with MS is indicated by, (not observed). JNK-dependent sites are red, GSK3β-sites are yellow, and black indicates either JNK or GSK3β-dependent phosphorylation.


