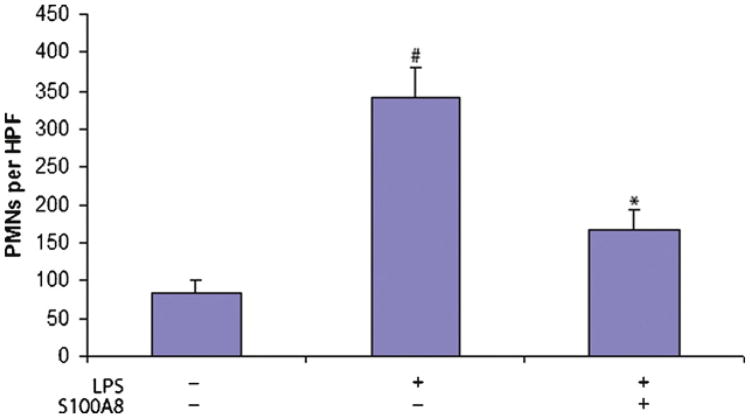
Fig. 2.
Quantification of PMNs in lungs. PMNs were identified morphologically in H&E sections. Value is shown as number (mean ± SEM) per high power field (HPF). The results presented are the product of the aggregation of three independent experiments conducted each with 5 mice per group. The data indicated a statically significant difference when comparing the LPS and LPS/S100A8 groups (*P < 0.01) and the LPS to the control saline treated group (#P < 0.01).

