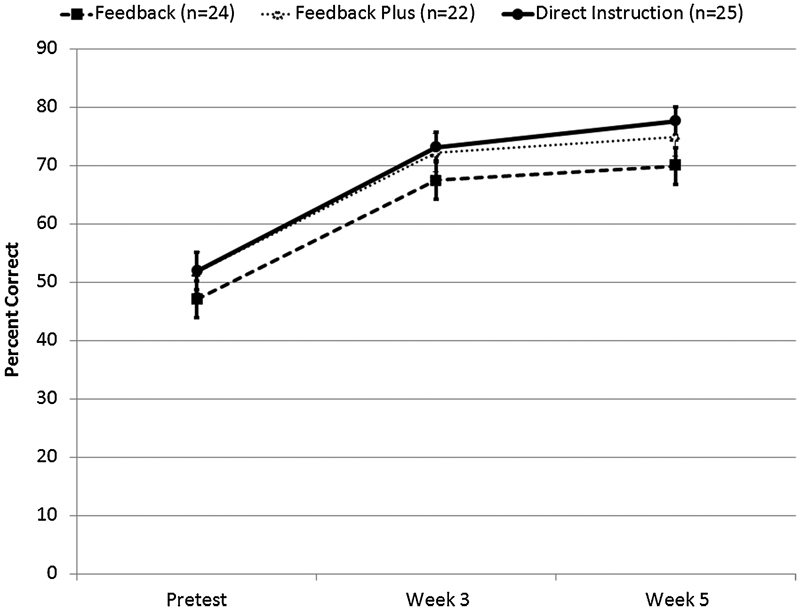
Figure 1.

Percent correct for each group measured at each testing period. Error bars indicate one standard deviation. The lines show the trajectory of each group and the markers represent the average percent of instruments identified correctly for the group. The corresponding error bars display one standard error.
