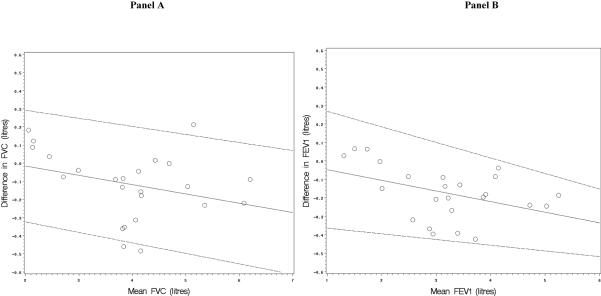
Figure 4.
Bland-Altman plots of the difference vs. mean value in measurements of the forced vital capacity (Panel A) and the forced expiratory volume in one second (Panel B) from the EasyOne and laboratory spirometry in clinical testing among spirometry-naïve volunteers.
The solid lines of the Bland-Altman plots are regression lines of mean differences vs. mean values which allow for proportionality of mean differences vs. mean values. The dashed lines are the 95% limits of agreement around the regression lines.

