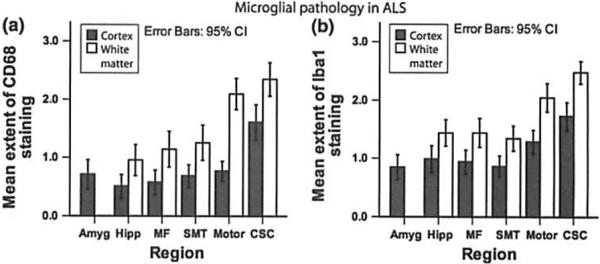
Fig. 3.

Microglial pathology in ALS. Bar plot shows microglial activation in the cortex and White matter Of different regions of the central nervous system of ALS as delected by staining for CD68 (a) and Ibal (b). Whiskers in bar plot indicate 95% confidence interval of mean. Amyg amygdala, CSC cervical spinal cord. Hipp hippocampus (CA1, subiculum), MF middle frontal gyrus, Mot motor conex, NL neuronal loss. SMT superior or middle temporal gyrus
