Figure 3.
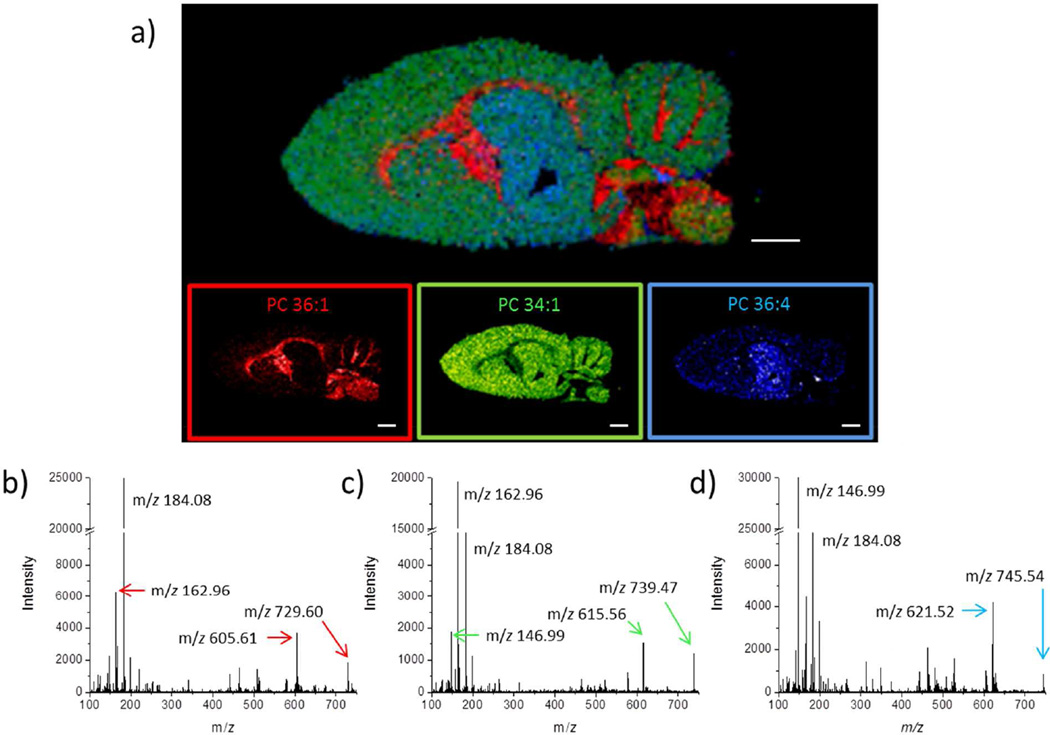
a) Image overlay of three PC lipid species analyzed using ion mobility MALDI IMS: PC 36:1 (red), PC 34:1 (green), PC 36:4 (blue). Scale bars are 2 mm. On-tissue MS/MS spectra for the precursor b) protonated ion of PC 36:1 at m/z 788.62, c) potassiated ion of PC 34:1 at m/z 798.54 and d) sodiated ion PC 36:4 at m/z 804.55 were obtained prior to on-tissue hydrogel digestion.

