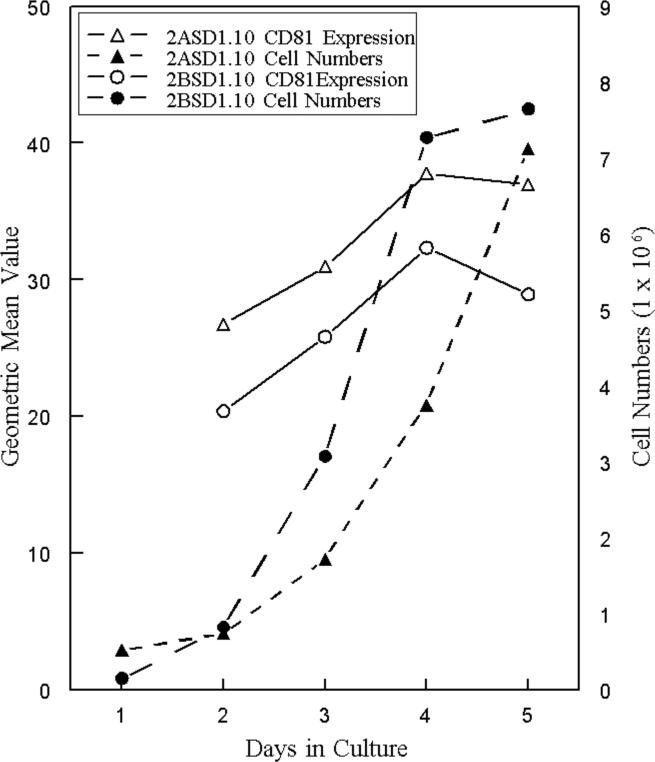
Figure 8.
Surface expression of CD81 on macrophage cell lines 2ASD1.10 and 2BSD1.10 during culture. CD81 was measured by flow cytometry and geometric mean values (fluorescence intensity per cell) (open symbols) were compared to cell growth (closed symbols). One representative experiment of two experiments with similar outcomes is shown.

