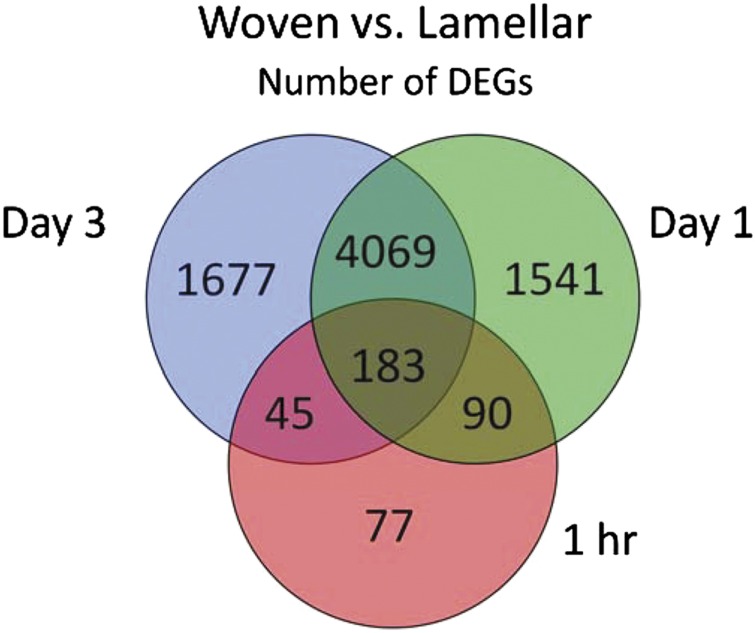
Figure 6.
Gene transcription profiles are greatly different for woven bone formation compared with lamellar bone formation. Venn diagram shows the number of differentially expressed genes (DEGs) in woven vs lamellar loading groups based on microarray analysis of rat ulnae collected 1 h, 1 and 3 days after mechanical loading. From McKenzie et al.65

