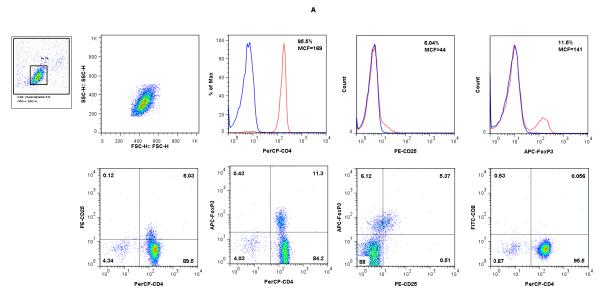
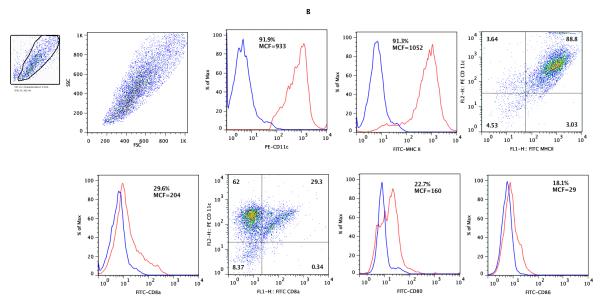
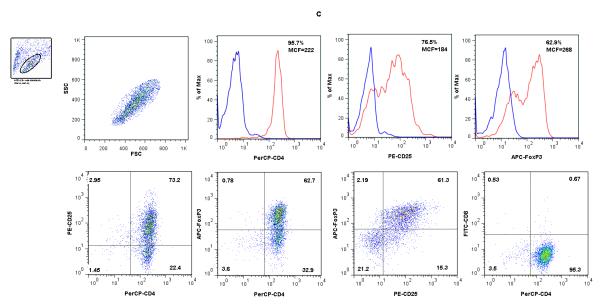
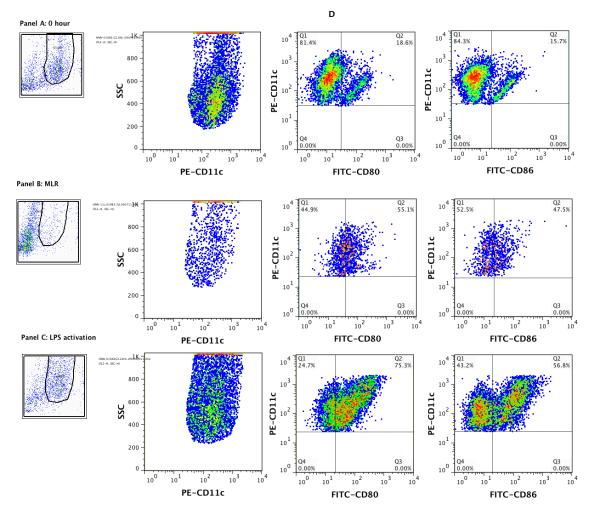
Figure 1. Flow cytometry analysis of freshly isolated BALB/c CD4+ T cells (A), B6 CD11c+ splenic DCs (B), and cells following co-culture of CD4+ T cells with B6 CD11c+ splenic DCs, IL-2 and TGF-β1 (C &D).


CD4+ T cells from BALB/c mice spleens (Panel A) and CD11c+ DCs from B6 mouse spleens (Panel B) were co-cultured in the presence of IL-2 and TGF-β1 and analyzed after 5 days of culture (Panels C and D). The live lymphocyte or DC population was based on size and granularity (R1) gated in the upper left corners. In each histogram, the red line shows the percentage of positive cells and MCF values for CD4, CD25, Foxp3 (panels A and C), CD11c, MHC II, CD8a, CD80, or CD86 (panel B), and the blue line shows values for respective isotype controls. (C) Following co-culture of CD4+ T cells with irradiated B6 splenic DCs in the presence of IL-2 and TGF-β1, the percentage of cells co-expressing CD25 and Foxp3 increased from 5.37% (A) to 61.3% (C). (D). Flow cytometry analysis of CD11c gated cells; CD80 or 86 expression by freshly isolated CD11c+ DCs (top panels); CD11c DCs retrieved 5 days of co-culture with CD4+ T cells, IL-2 and TGF-β1 (middle panels); CD11c+ DCs cultured overnight with 100ng/ml LPS (lower panels). Results shown are representative of two to three experiments.

