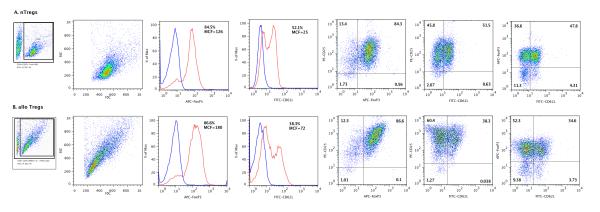
Figure 2. Flow cytometry analyses of naturally occurring regulatory T cells (nTregs) (A) and DCs, IL-2 and TGF-β1 differentiated alloantigen specific regulatory T cells (alloTregs) (B).

nTregs were isolated from spleens of BALB/c mice aged 6 to 10 weeks using antibody-tagged magnetic beads provided in the Mouse CD4+CD25+ Regulatory T Cell Isolation kit (Miltenyi Biotech Inc, Auburn, CA). To generate alloantigen induced Tregs, CD4+ T cells purified from BALB/c spleen cells were co-cultured with B6 splenic DCs, IL-2 and TGF-β1 for 5-6 days, followed by enrichment of the CD4+CD25+ fraction. The lymphocyte population was based on size and granularity (R1) gate. In each histogram the red line shows the percentage of positive cells and MCF values for Foxp3 and CD62L, and the blue line shows values for isotype controls. Panels on the right show two color analyses for CD25 and Foxp3, CD25 and CD62L, and for Foxp3 and CD62L. Results shown are representative of three separate experiments.
