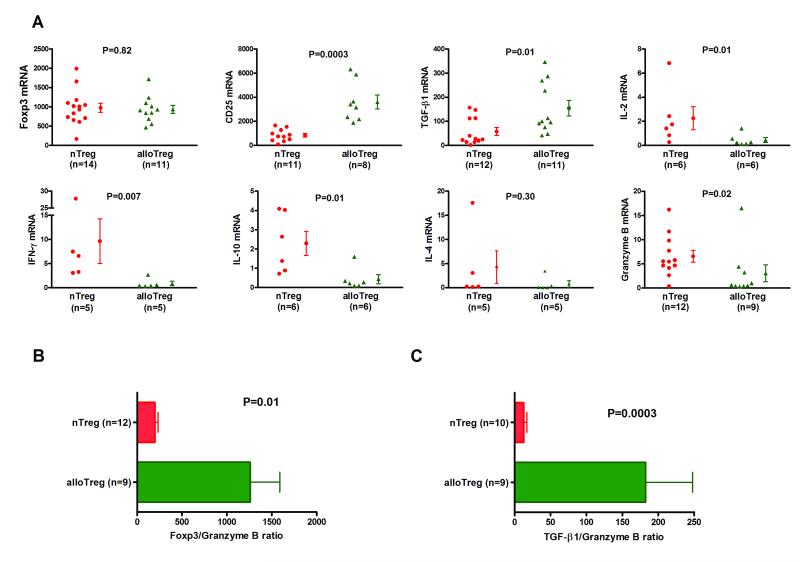
Figure 3. Differential mRNA expression patterns of nTregs and alloTregs.
Total RNA was isolated from nTregs or alloantigen induced Tregs (alloTregs), and absolute levels of mRNA for Foxp3, CD25, TGF-β1, IL-2, IFN-γ, IL-10, IL-4, or granzyme B were measured with the use of real-time quantitative PCR assays. (A) Individual and mean (±SE) mRNA levels are shown as a ratio of mRNA copies per one μg of RNA to 18S ribosomal RNA copies per one pg of RNA. Levels of Foxp3 mRNA were not different between alloTregs and nTregs (937 ± 104 vs. 976 ± 120, P>0.05) and levels of CD25 mRNA (3606 ± 588 vs. 839 ± 150, P=0.0003) and TGF-β1 mRNA (154 ± 32 vs. 58 ± 16, P=0.01) were higher in alloTregs than nTregs. Levels IL-2 mRNA (0.45 ± 0.2 vs. 2.26 ± 1.0, P=0.01), IFN-γ mRNA (0.86 ± 0.5 vs. 9.64 ± 4.6, P=0.007), IL-10 mRNA (0.44 ± 0.2 vs. 2.29 ± 0.6, P=0.01) and granzyme B mRNA 3.05 ± 1.8 vs. 6.56 ± 1.2, P=0.02) were lower in alloTregs than nTregs. (B) The ratio of Foxp3 mRNA to granzyme B mRNA (1259 ± 331 vs. 199 ± 34, P=0.01) was higher in alloTregs than nTregs. (C) The ratio of TGF-β1 to granzyme B mRNA (182 ± 66 vs. 12 ± 5, P=0.0003) was higher in alloTregs than nTregs. P values calculated using the Mann-Whitney test.

