
Figure 5.
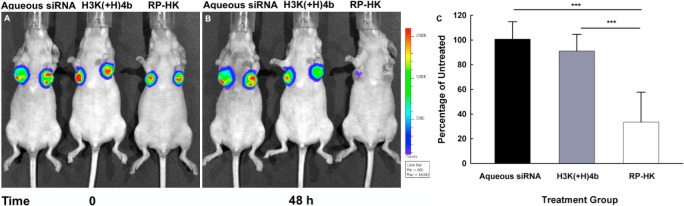
Bioluminescence assay for silencing of luciferase expression. The representative mice were from the same treatment groups used for the biodistribution study. Panels A and B show tumor bioluminescence images of representative mice taken before and 48 h after treatment, respectively. The treatment groups in A and B were as follows (from the left to right): aqueous siRNA, H3K(+H)4b, and RP-HK nanoplexes, respectively. (C) The percent silencing of luciferase activity by different treatment groups compared to the untreated control group represents the mean ± SD of fluorescence of four determinations. ***, P < 0.001.