
Figure 3.
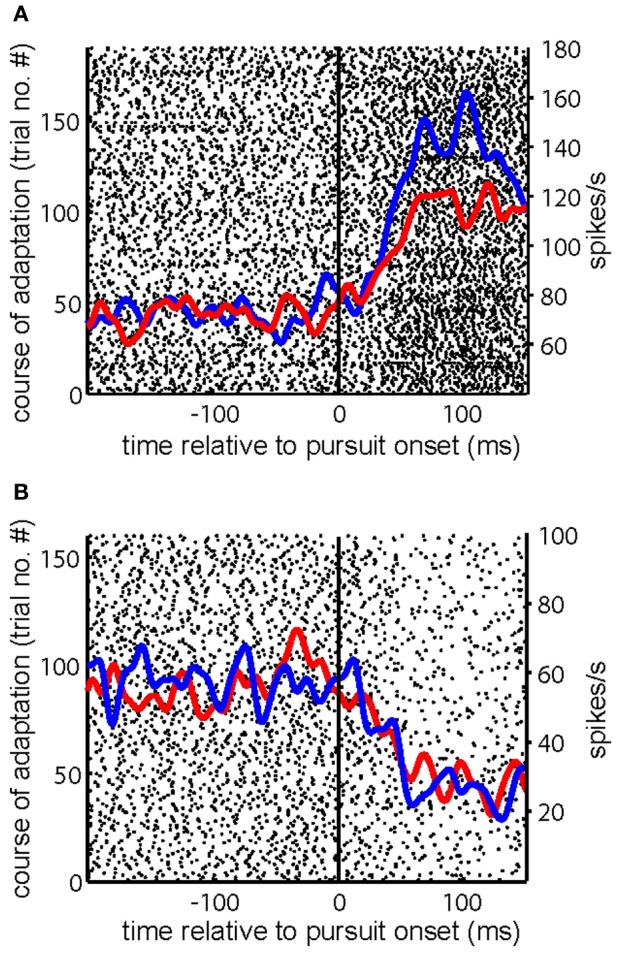
Examples of PC SS during gain decrease SPA. (A,B) Show the raster plot of a PC SS during the course of gain-decrease SPA with superimposed spike density functions for the first (blue) and the last (red) quarter of the trials. The solid vertical line indicates SPEM onset. The course of adaptation is from bottom to top.